
Photo Credit: Reinhardt and Co / Shutterstock
The need for affordable housing in the United States has never been greater. After a dizzying run-up in residential real estate prices and rents in the last few years, housing costs are putting a financial squeeze on renters and homebuyers nationwide as they compete for a scarce, expensive supply of housing.
Research from federal mortgage backer Freddie Mac estimates that the U.S. is short 3.8 million housing units relative to current market needs, while the National Association of Realtors pegs the figure even higher at 5.5 million units. Regardless of the precise number, it is clear that the U.S. housing supply is insufficient, creating more competition for fewer units.
Experts cite a variety of factors that contribute to difficulties adding housing stock. In every state and locality, housing development may be subject to a host of laws and regulations regarding zoning, land use, building standards, environmental protection, historic preservation, and other issues that make it difficult to add housing. Developers and political officials may also face organized pressure from “not in my backyard” (NIMBY) interests concerned about neighborhood property values, overcrowding, or disruptions from construction work. Further, rising labor and material costs have made it more expensive to build over time, which impacts the type of units builders can afford to construct along with project timelines and costs.
Trends in U.S. Housing Construction Over Time
Since the 2008 housing market crash, the U.S. has underinvested in new residential construction
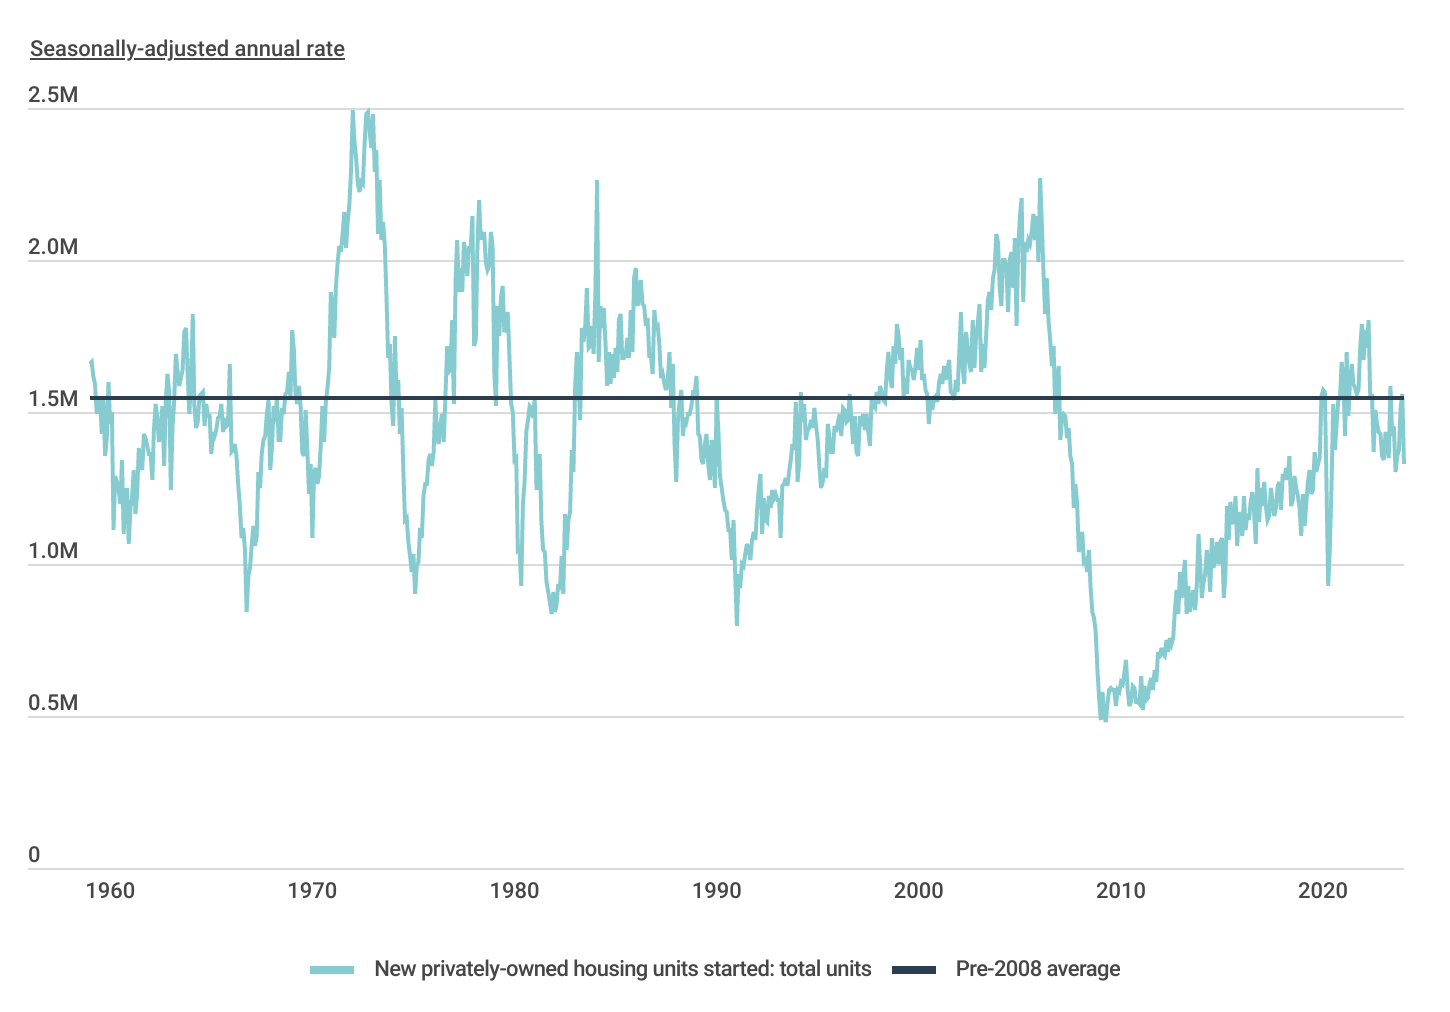
Source: Construction Coverage analysis of Census Bureau data | Image Credit: Construction Coverage
Beyond these conditions, one of the most significant drivers for the current undersupply of housing is the long-term impact of the Great Recession. Following the collapse of the housing bubble in the mid-2000s and the ensuing economic downturn, construction companies were extremely hard-hit. The industry experienced mass layoffs, many firms shuttered or were absorbed into others, and residential construction activity slowed dramatically. The annual rate of housing starts fell from more than 2 million at the height of the housing market in 2006 to just 490,000 at the beginning of 2009. After a prolonged recovery, housing starts did not exceed pre-2008 averages again until the beginning of 2020.
Housing Growth by State
Mountain West states & Texas have added the most housing over the past 10 years
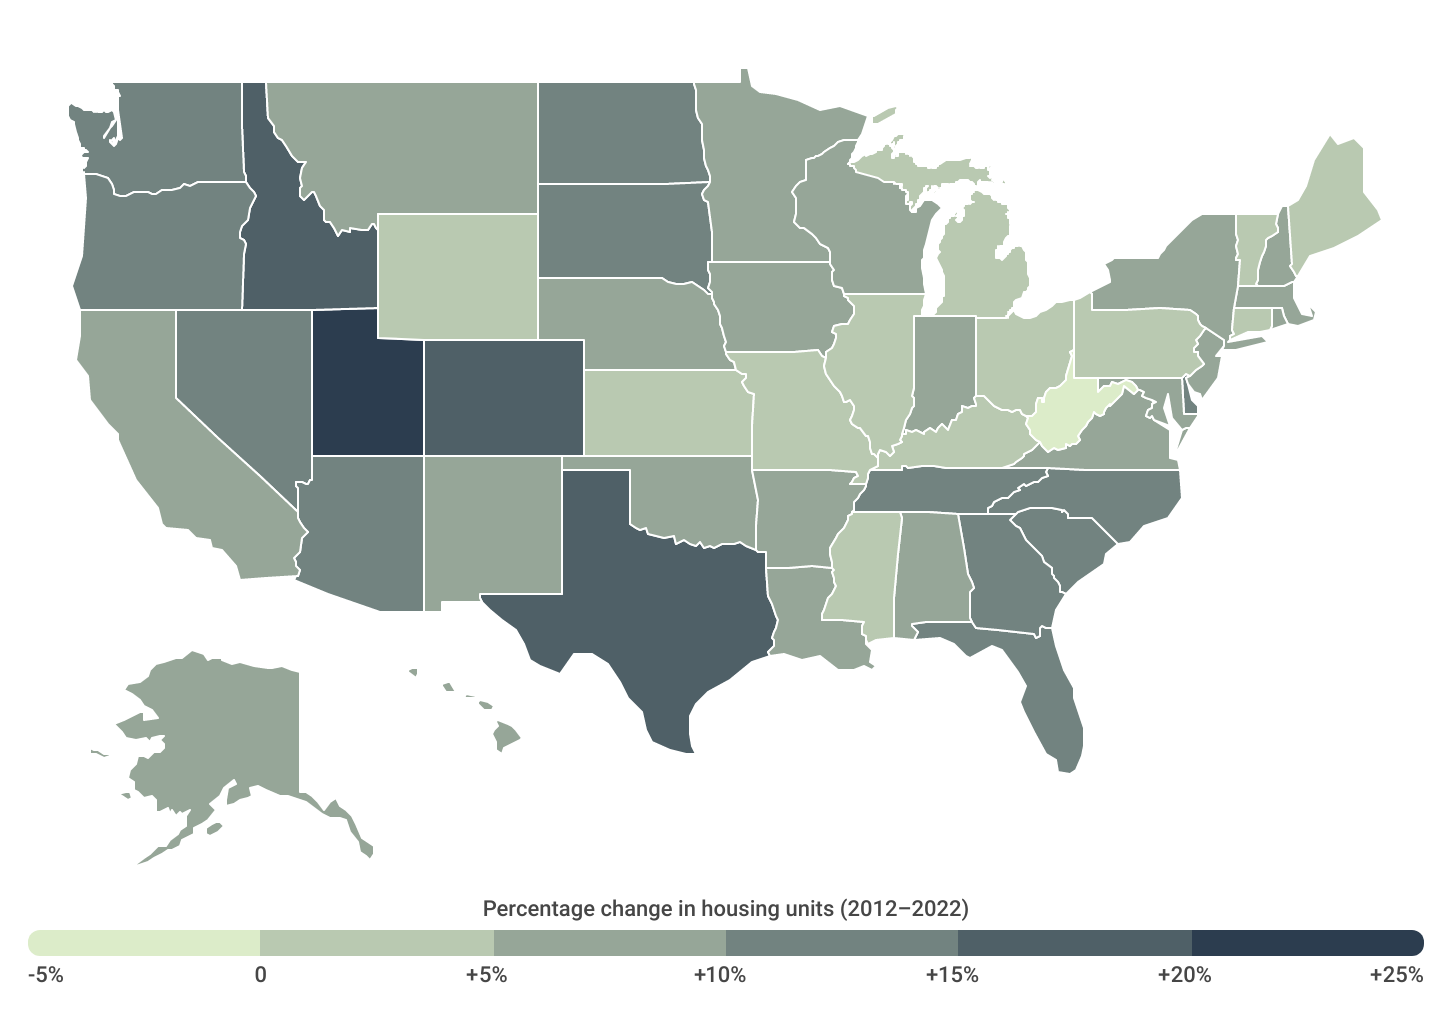
Source: Construction Coverage analysis of Census Bureau data | Image Credit: Construction Coverage
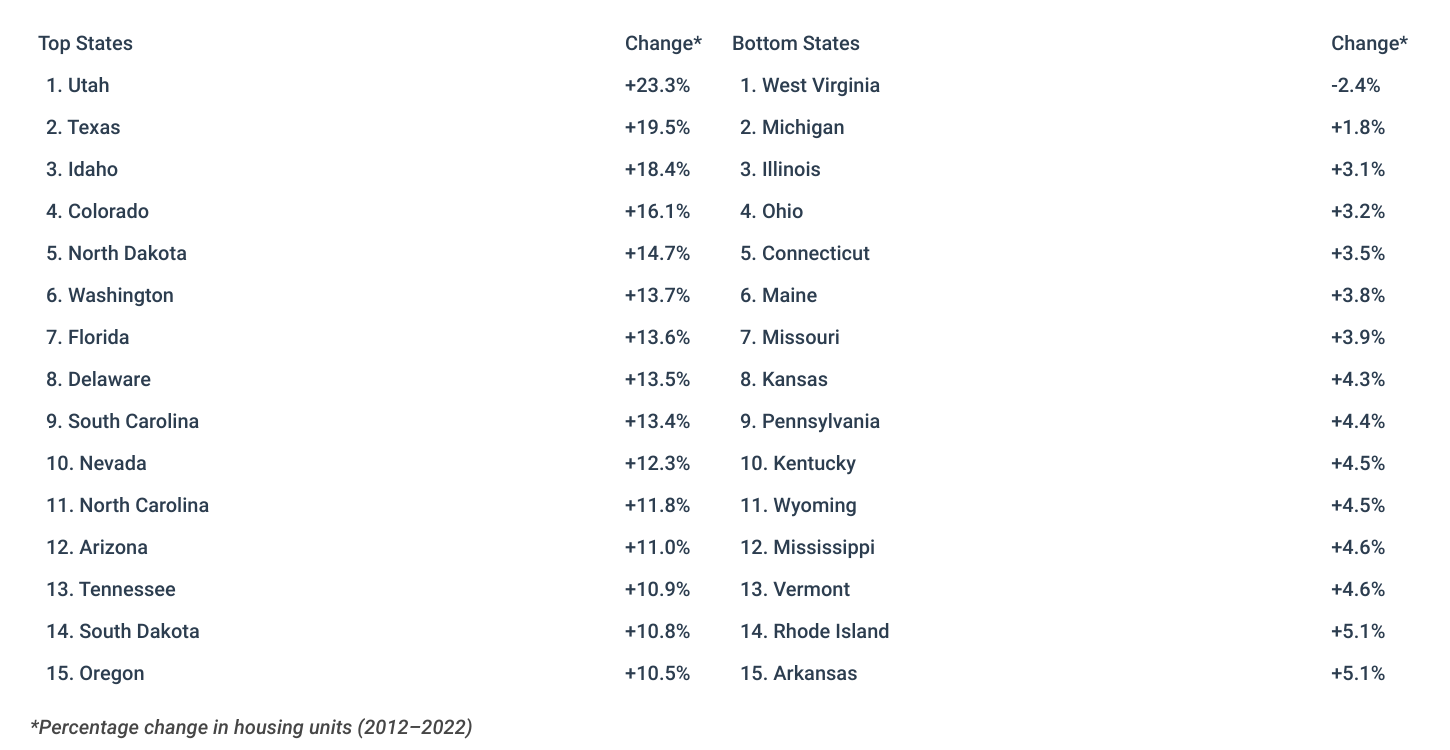
While the national supply of housing has been lagging overall, some parts of the country have managed to add homes faster than others. States that have experienced the most housing growth in recent years are found in the Mountain West and Sun Belt, which tend to be less expensive than heavily developed coastal markets and have fewer regulations limiting construction. Utah leads the U.S. with a 23.3% increase in housing stock over the last decade, with Texas second at 19.5% and other western states like Idaho and Colorado ranking highly. In contrast, one state—West Virginia—has experienced a 2.4% decline in housing stock, and Great Lakes states like Michigan, Illinois, and Ohio have seen relatively low rates of growth amid stagnating or declining populations.
Housing Growth vs. Population Growth for U.S. Counties
Relative to population growth, locations in Texas & Utah have added housing at a faster pace than average
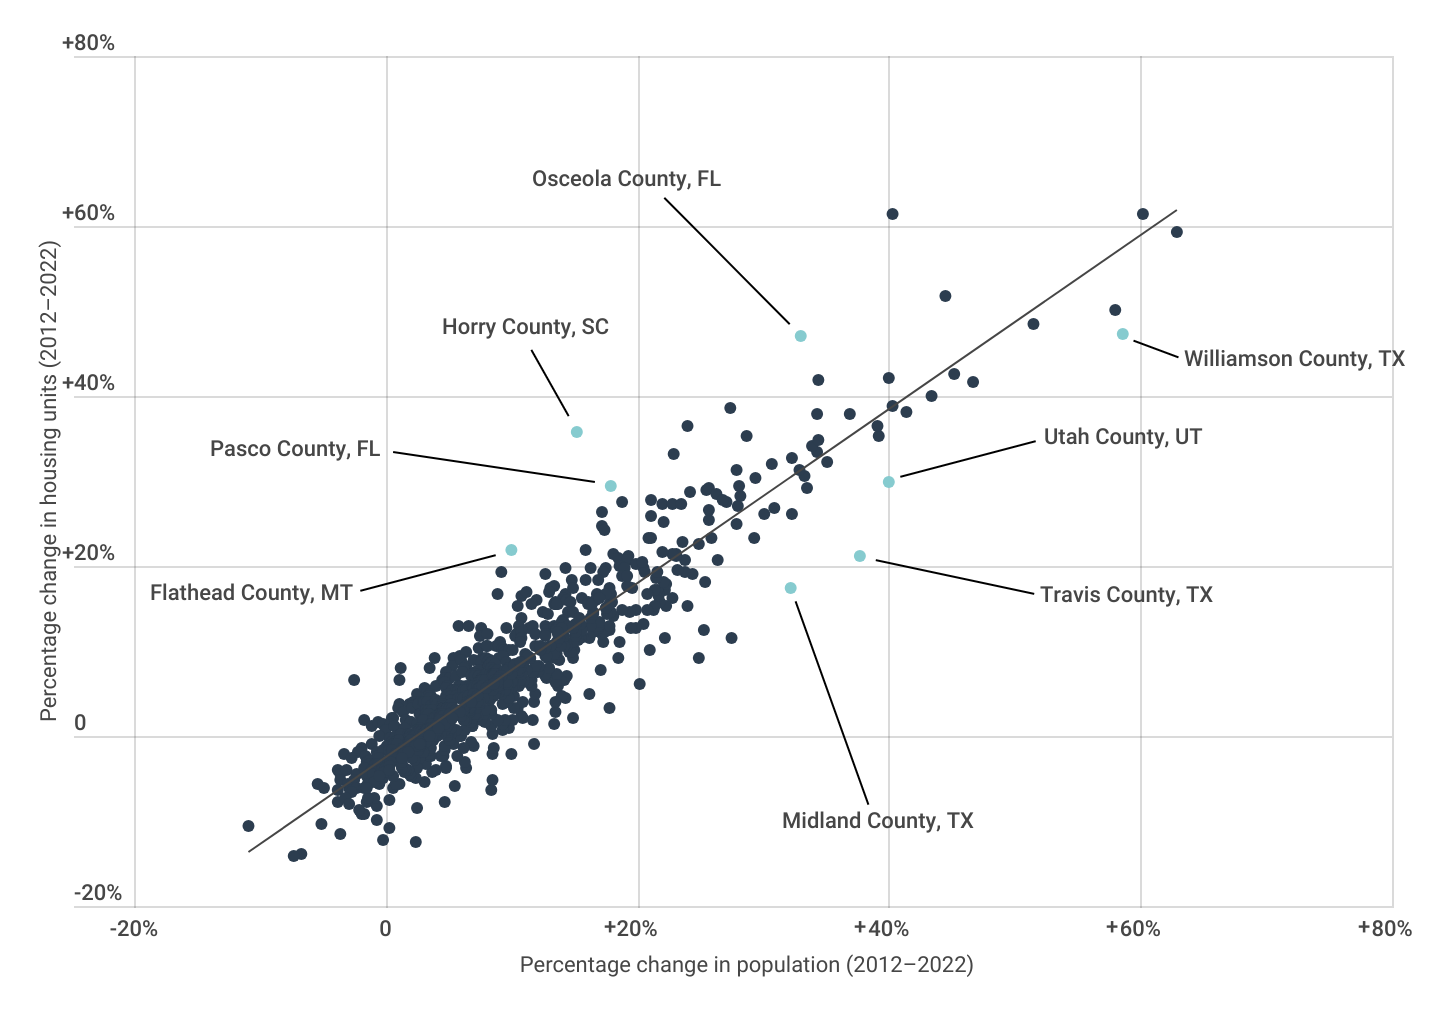
Source: Construction Coverage analysis of Census Bureau data | Image Credit: Construction Coverage
But rates of housing supply growth may not be sufficient to understand how well a location is meeting current and future housing needs. In some places, housing growth is exceeding the rate of population growth, which positions those markets to keep housing affordable now while also being better able to accommodate new residents in the future. Many counties in fast-growing Utah and Texas have added stock faster than they have added people. But in parts of Florida, Idaho, Montana, and other growing states, the opposite is true. These markets may experience greater competition as their populations continue to grow.
Below is a complete breakdown of housing growth across nearly 800 U.S. counties (grouped by size) and all 50 states. The analysis was conducted by Construction Coverage, a website that provides construction insurance guides, using data from the Census Bureau and Zillow. For more information, see the methodology section below.
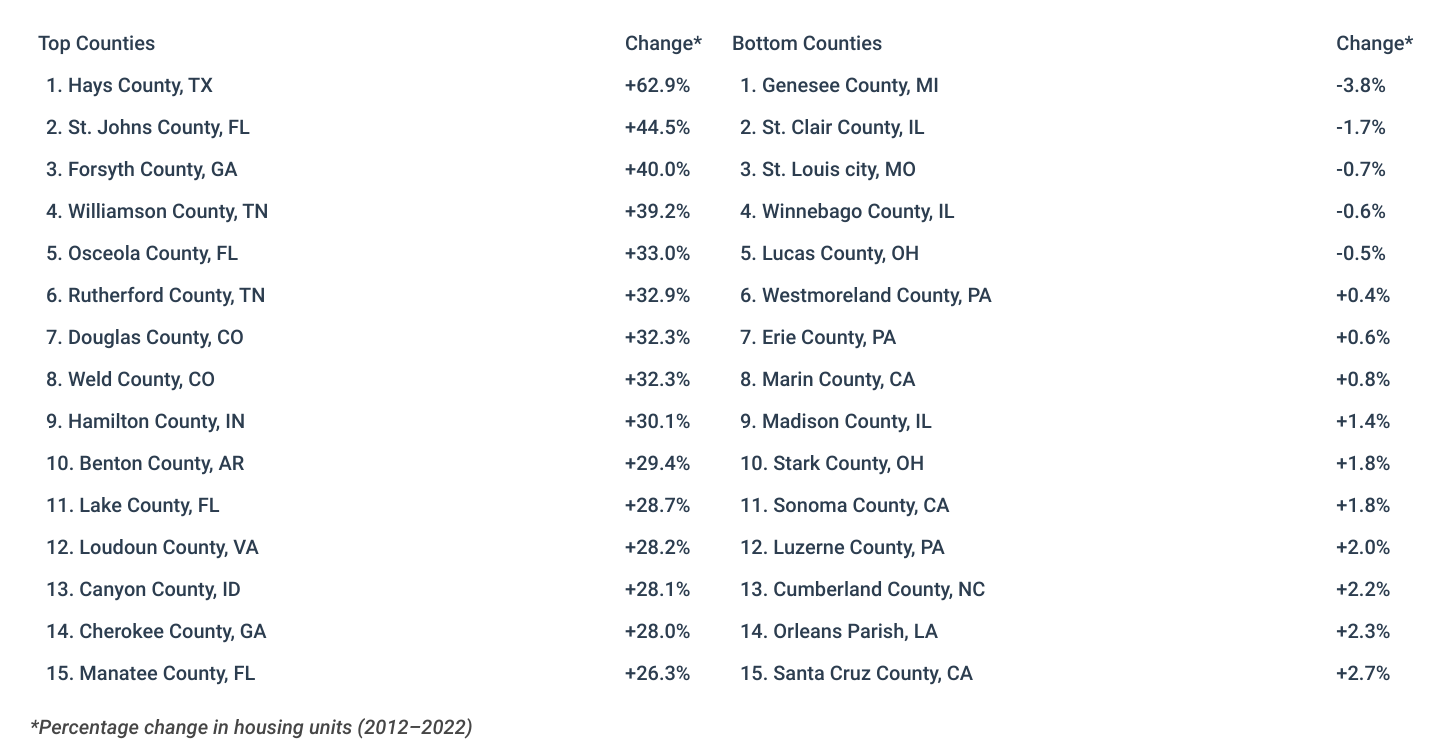
Large Counties With the Most Housing Growth
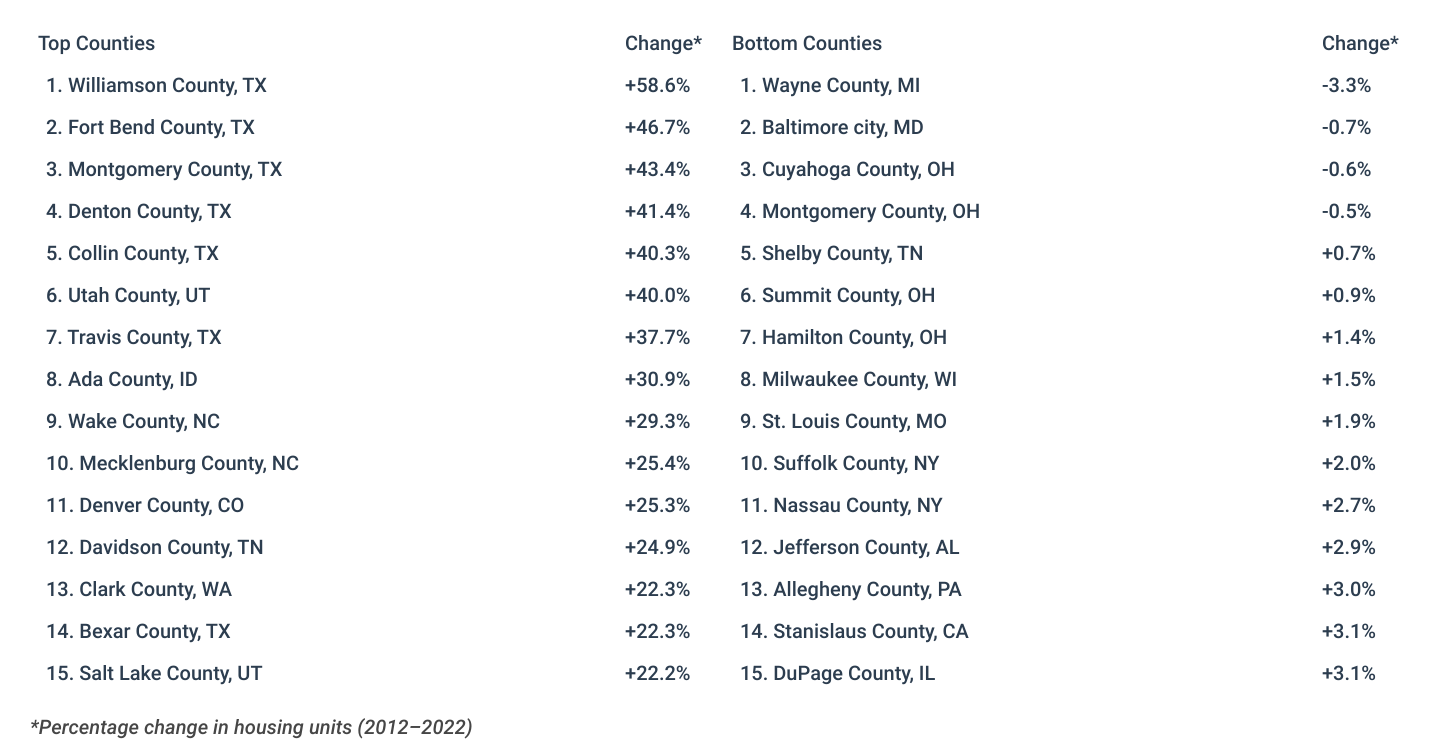
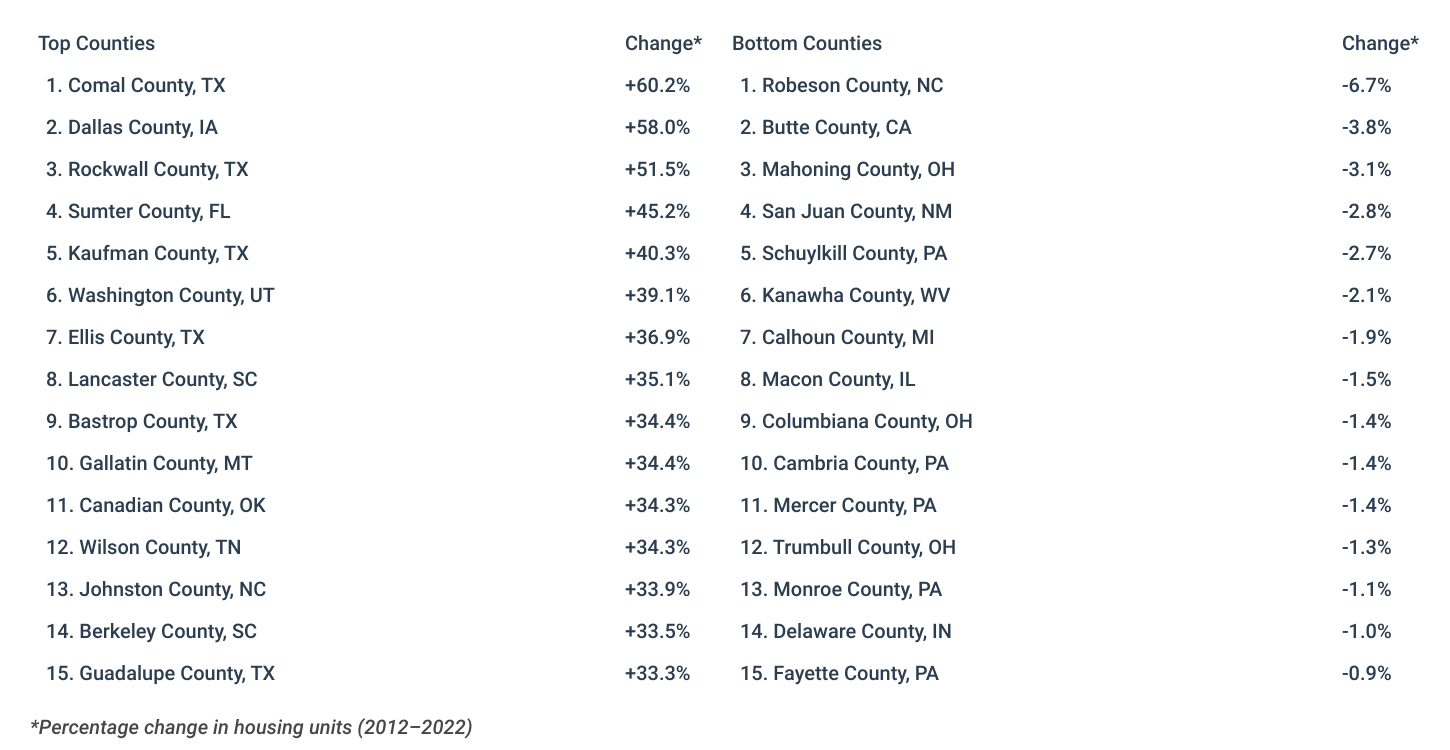
Midsize Counties With the Most Housing Growth
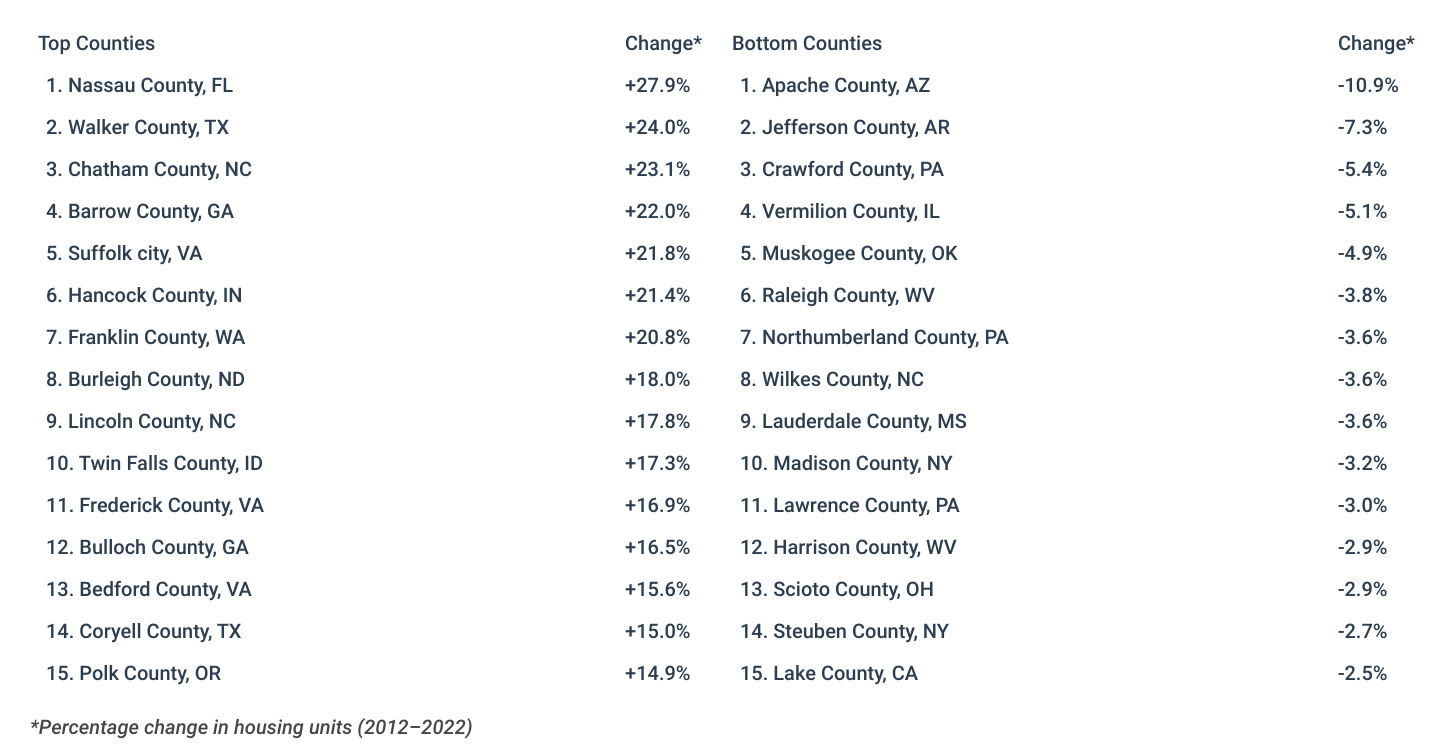
Small Counties With the Most Housing Growth
Very Small Counties With the Most Housing Growth
States With the Most Housing Growth
Methodology
Photo Credit: Reinhardt and Co / Shutterstock
Population and housing unit estimates are from the U.S. Census Bureau’s American Community Survey 1-Year Estimates (2012 and 2022). Median home prices are from Zillow’s Housing Data Series. All changes were calculated between 2012 and 2022. Only locations with data available from the Census Bureau were included in the analysis. Additionally, counties were grouped into cohorts based on population: large (500,000 or more); midsize (250,000–499,999), small (100,000–249,999); and very small (less than 100,000).
For complete results, see U.S. Counties That Have Built the Most Housing Over the Past Decade on Construction Coverage.


