
Photo Credit: Branislav Nenin / Shutterstock
The U.S. economy has continued to defy pessimistic expectations in recent months, with employment, wages, and consumer spending remaining resilient amid high inflation and rising interest rates. But one part of the economy that has retracted is venture capital investment.
Venture capital financing has been a major catalyst for business growth in recent years, particularly through innovations in fields like technology and software. Now-ubiquitous tech companies like Uber and Airbnb got their starts as venture-backed startups within the last 15 years, but the impact of VC investment has flowed into every corner of the economy. As of late, however, high interest rates have pushed venture investors to be more conservative, making it harder for new startups to raise funding and leading to widespread layoffs in many venture-backed companies.
U.S. Venture Capital Investment Growth
Growth in venture funding has dramatically outpaced GDP in recent decades
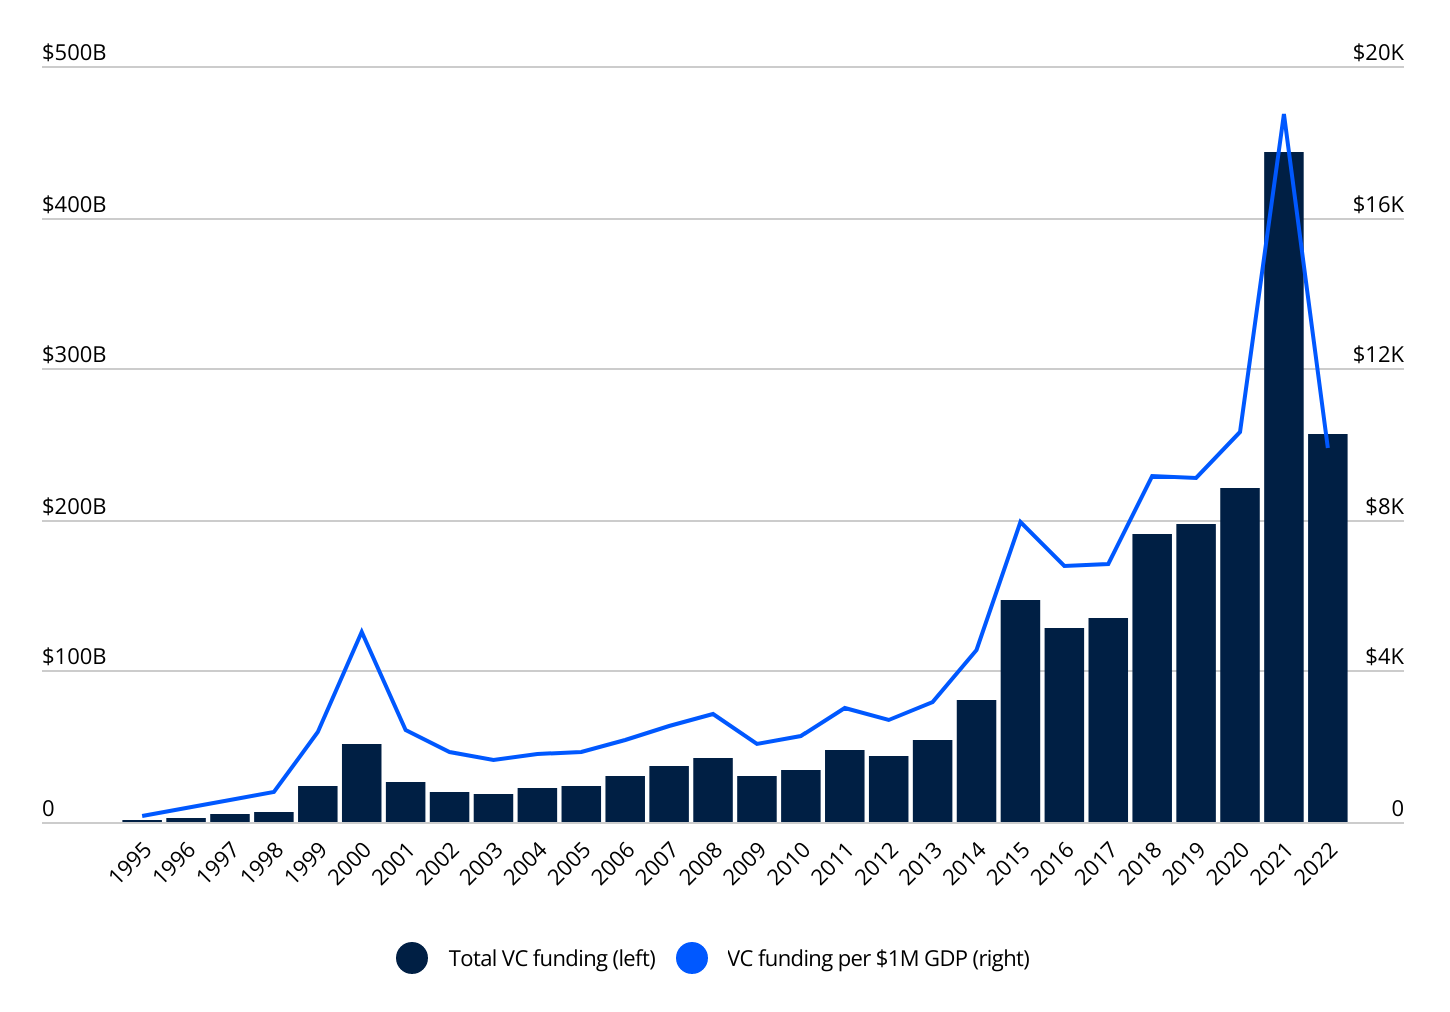
Source: Flippa analysis of National Science Foundation/Pitchbook data | Image Credit: Flippa
Total annual venture capital investment rose more than tenfold from the start of the Great Recession in 2007 to venture capital funding’s peak in 2021, buoyed by low interest rates during the long recovery from the recession. Over that span, venture capital funding also increasingly outpaced overall GDP growth in the U.S., solidifying itself as a mainstay in the business funding landscape. But from 2021 to 2022—as inflation began to spike and interest rates subsequently began to rise—total VC funding fell by almost half, from $443 billion to $256 billion.
Trends in U.S. Venture Capital Deal Sizes & Frequency of Investment
While average deal sizes have grown in recent years, they remain below dot-com era highs
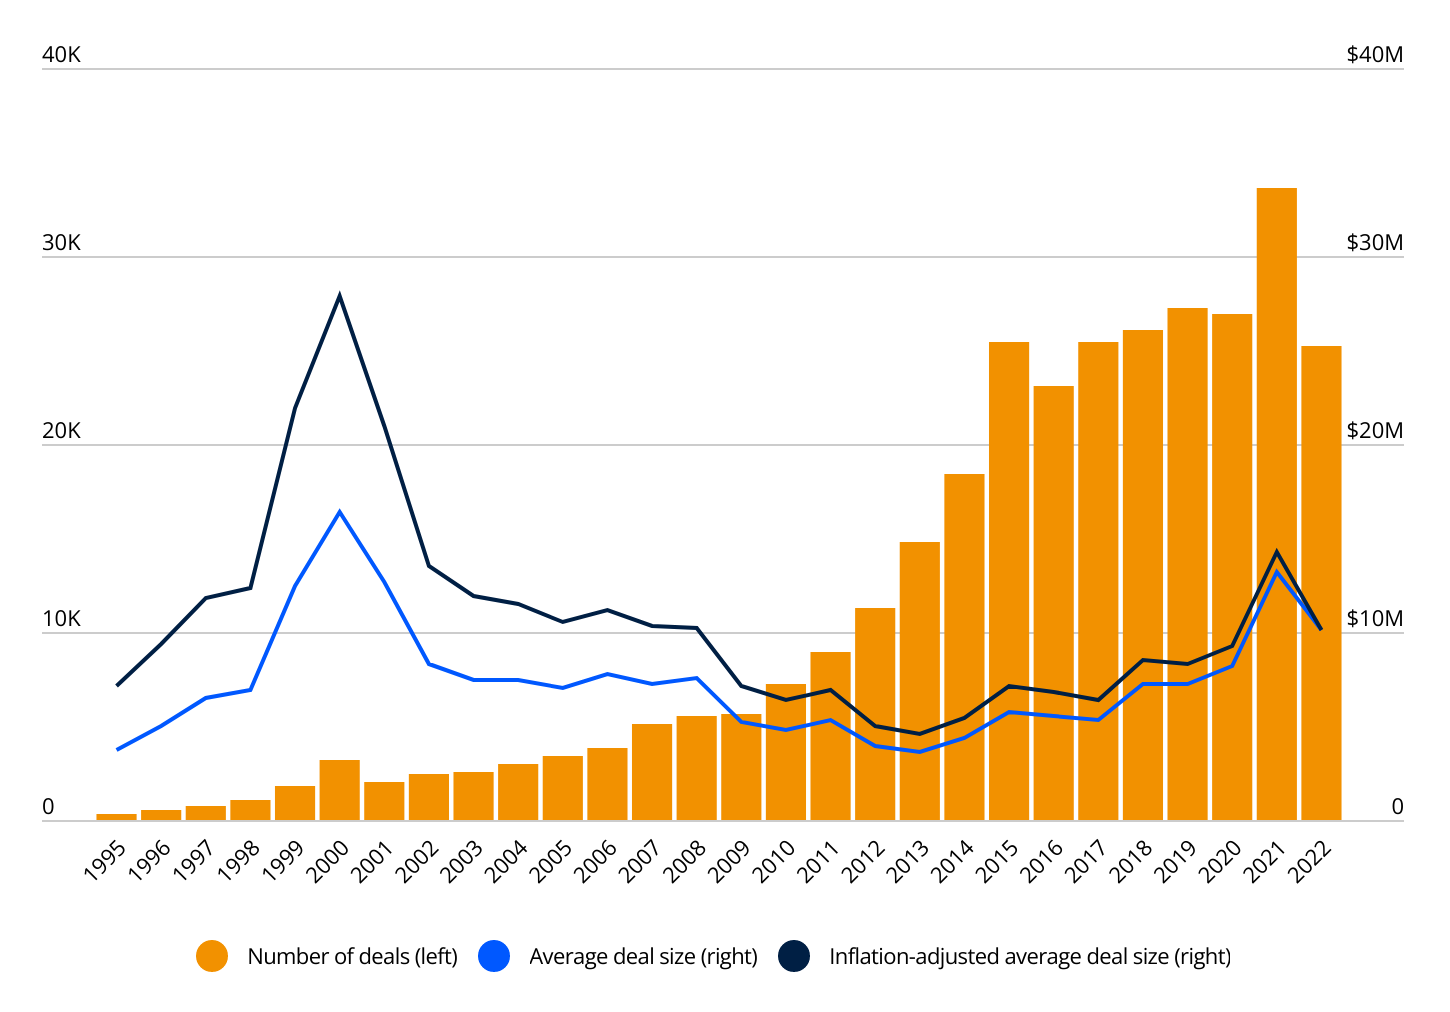
Source: Flippa analysis of National Science Foundation/Pitchbook data | Image Credit: Flippa
While overall venture capital investment increased during the last two decades, the size of each investment has remained relatively low compared to historic peaks. During the dot-com era, average deal sizes reached a height of nearly $28 million in today’s dollars but fell off quickly when the bubble burst. Today, the total number of deals completed each year is significantly higher, but while deal sizes have trended upward over the last decade, the average deal size in 2022 was just $10.1 million.
Recent Venture Capital Investment by Company Location
Massachusetts stands out for its VC activity relative to state GDP
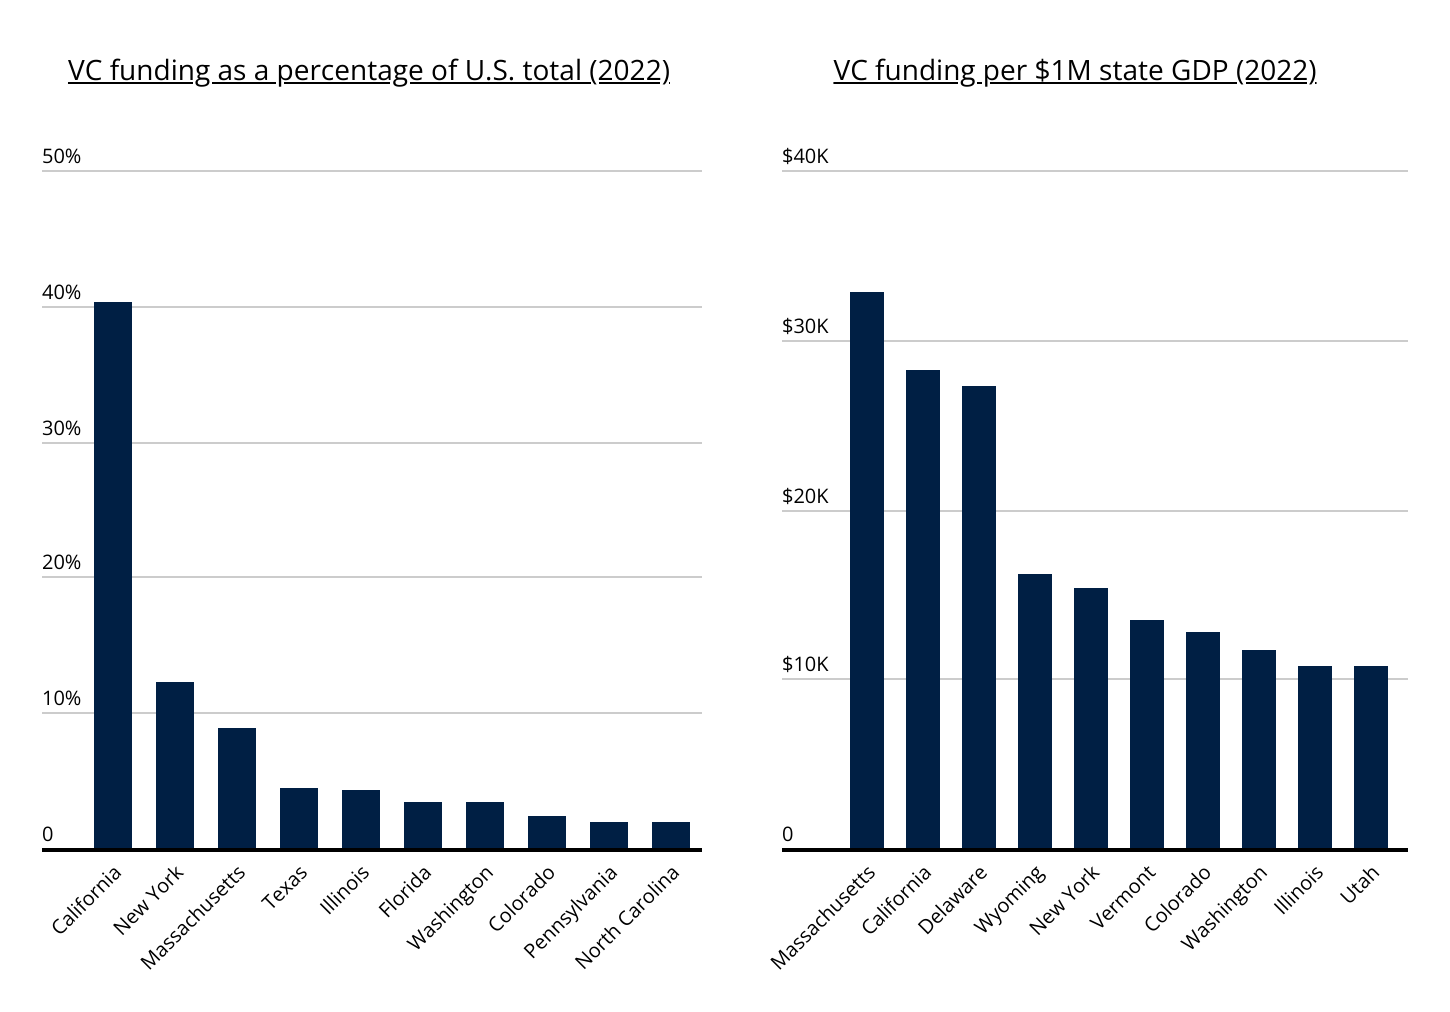
Source: Flippa analysis of National Science Foundation/Pitchbook data | Image Credit: Flippa
Venture capital investment is most robust in a select group of states that tend to have strong startup economies, including networks of existing entrepreneurs, a well-educated workforce, and capabilities in high-growth industries. More than half of all venture capital funding flows to just two states: California (40.2%) and New York (12.3%). But on a relative basis, Massachusetts leads the nation with $32,800 in VC funding per $1 million in state GDP. Delaware and Wyoming also rank highly on a per-GDP basis thanks to their business-friendly laws and tax regimes.
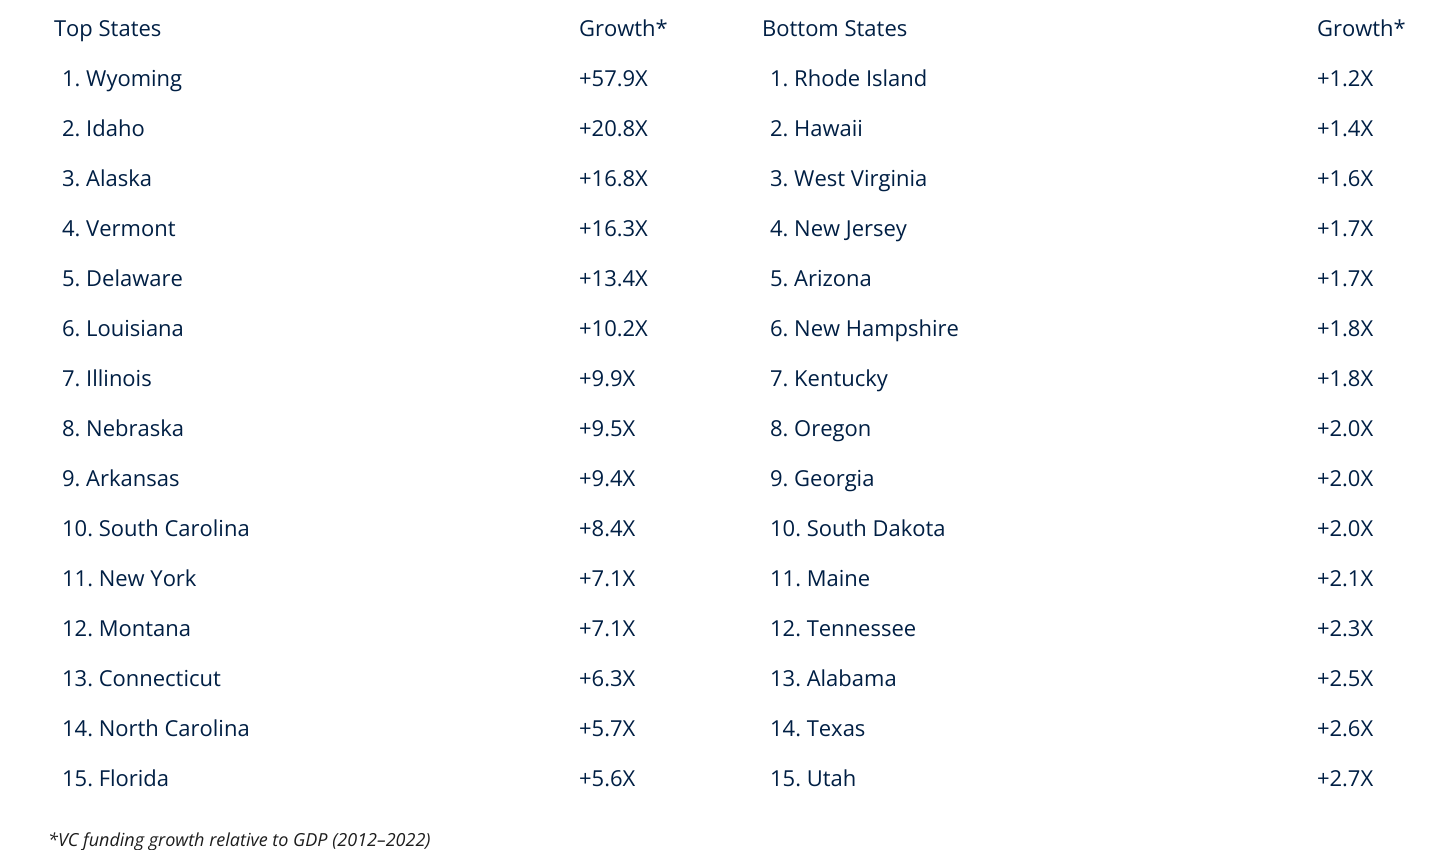
Venture Funding Growth by State
Since 2012, Mountain states Wyoming & Idaho experienced the largest VC investment growth
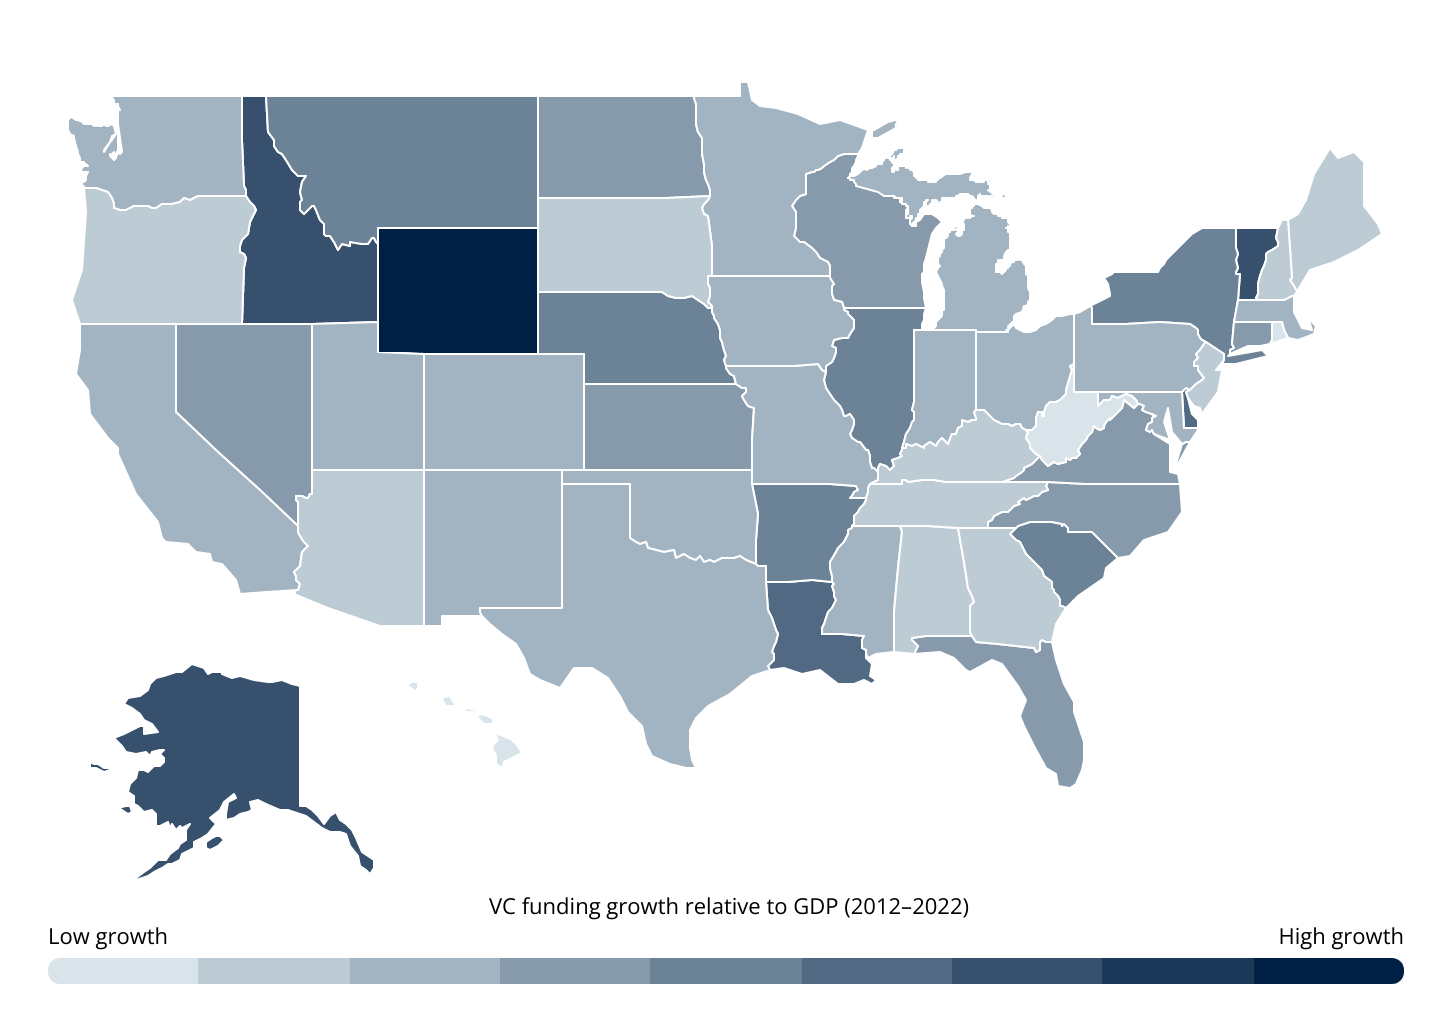
Source: Flippa analysis of National Science Foundation/Pitchbook data | Image Credit: Flippa
Wyoming is also the state that has shown the most rapid growth in VC funding over the last decade. Total VC investment in Wyoming exploded from $10.8 million in 2012 to $792.6 million in 2022, and on a per-GDP basis, the level of VC investment in the state increased by nearly 58 times over that span. Neighboring Idaho ranks second (20.8X increase) while Alaska ranks third (16.8X increase). Each of these states is smaller and tends to have relatively few VC deals compared to other states, which may contribute to the relative impact on GDP.
Below is a complete breakdown of all 50 states. The analysis was conducted by Flippa, a marketplace to buy and sell digital businesses, using data retrieved from the National Science Foundation. For more information on calculations and methods, refer to the methodology section below.
States With the Biggest Increase in VC Funding Over the Past 10 years
Methodology

Photo Credit: Branislav Nenin / Shutterstock
The data used in this analysis comes from the U.S. Bureau of Economic Analysis and PitchBook, retrieved from the National Science Foundation’s National Center for Science and Engineering. Researchers at Flippa compared total venture capital disbursed in each state relative to the state’s GDP in both 2022 and 2012 to determine those that experienced the most growth. The data represents venture capital funding secured by companies in each state and includes all stages of financing, from seed to later-stage investments.
For complete results, see States With the Largest Growth in Venture Capital Investment Over the Past Decade on Flippa.


