
Photo Credit: OlegRi / Shutterstock
Recent economic and geopolitical turmoil has dramatically impacted the global energy landscape, with the U.S. finding itself at the intersection of multiple converging forces. Russia’s invasion of Ukraine sent crude oil prices surging upwards and increased demand for already low global inventories. In response to this economic instability, the U.S. government undertook a historic drawdown of the Strategic Petroleum Reserve, aiming to mitigate price volatility and protect consumers.
While a measured start has been made towards replenishing strategic reserves, apprehension remains regarding their sufficiency in the face of potential future disruptions. But despite these concerns, advances in geological understanding and technology like horizontal drilling and fracking have actually expanded production in recent years.
Change in Oil Production & Trade Over Time
After becoming a net exporter of oil in 2020 for the first time, the U.S. continues to reduce its reliance on foreign oil
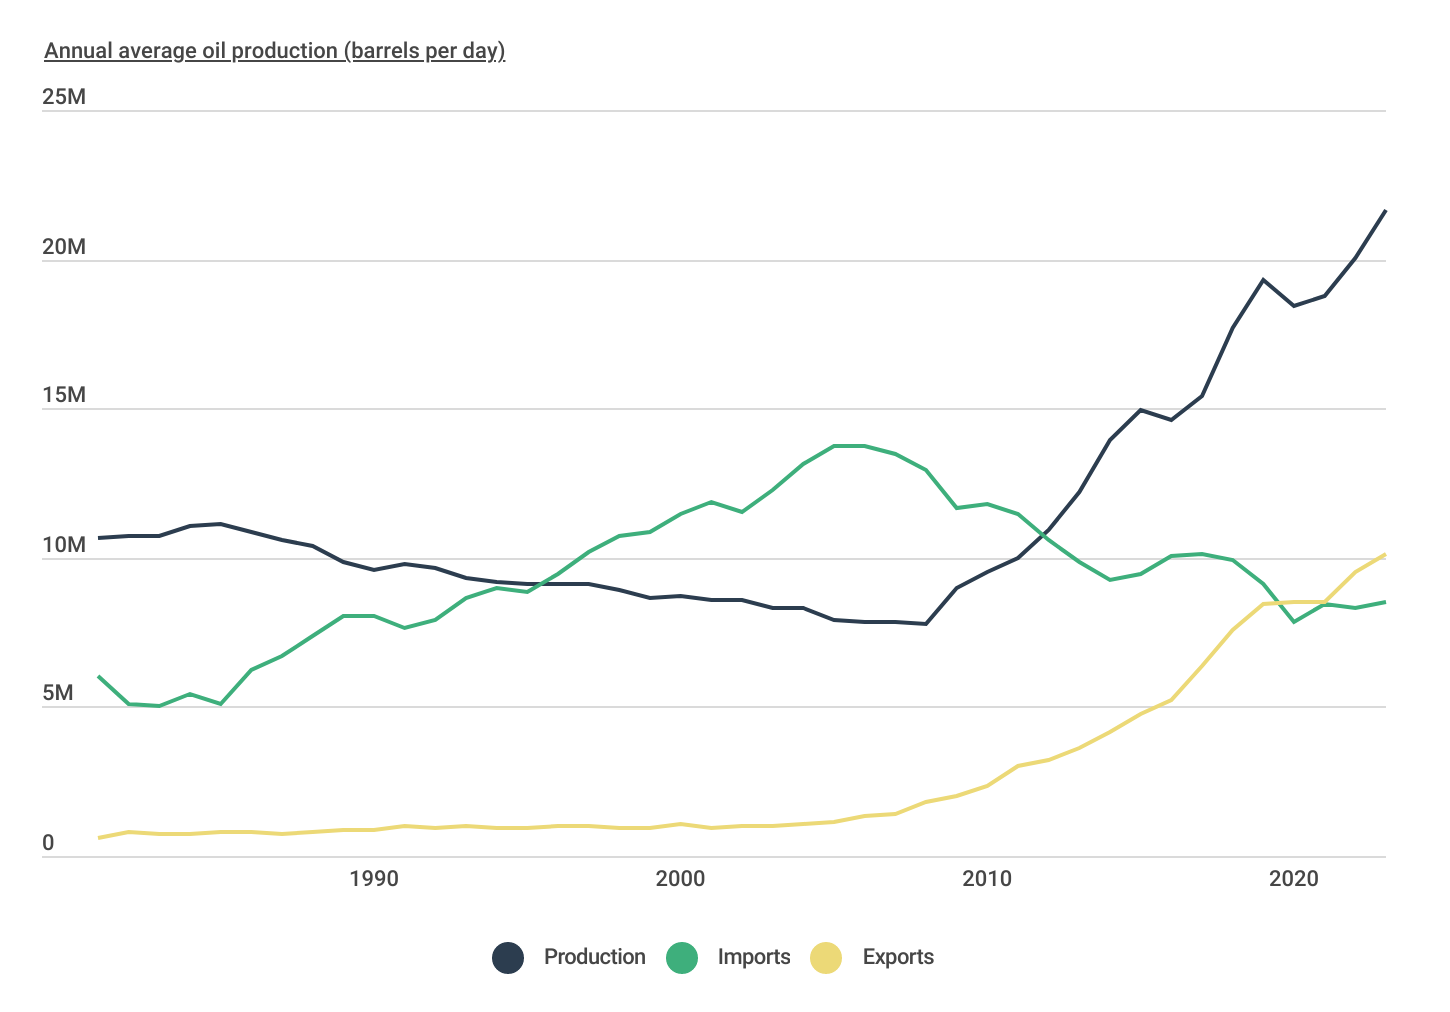
Source: Construction Coverage analysis of U.S. Energy Information Administration data | Image Credit: Construction Coverage
These new techniques were first widely adopted in the early to mid-2000s, and since then, the oil business in the U.S. has transformed. From the early 1980s to around 2008, U.S. oil production fell from 10.7 million barrels per day down to just 7.8 million, while oil imports more than doubled from 6.0 million to 12.9 million barrels per day. Since then, imports have fallen sharply while production and exports have grown. Average oil production in 2023 was nearly 22 million barrels per day, and in 2020, the U.S. became a net exporter of oil for the first time ever.
Growth in U.S. Proved Oil Reserves
After decades of decline, U.S. proved oil reserves have sharply increased since 2008
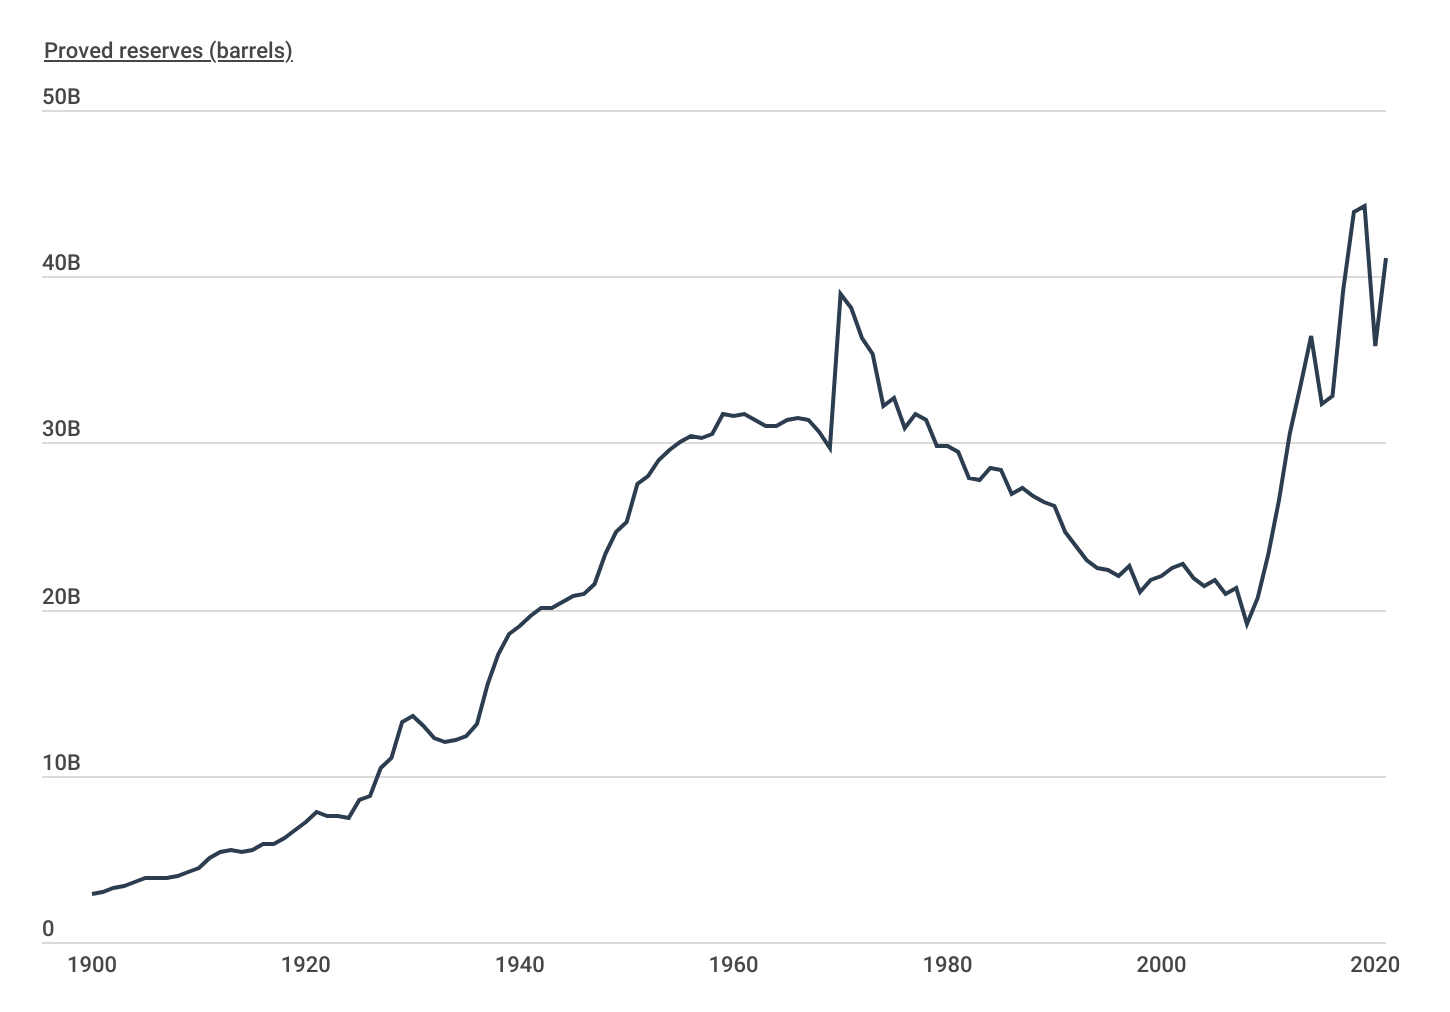
Source: Construction Coverage analysis of U.S. Energy Information Administration data | Image Credit: Construction Coverage
One important metric for capturing the growth in the oil industry in the U.S. is proved reserves. The U.S. Energy Information Administration defines proved reserves as the estimated volume of hydrocarbon resources that are recoverable under current economic and operating conditions, which can shift based on new discoveries, shifts in production capacity, or improved techniques and technologies. Proved reserves in the U.S. had peaked historically at 39 billion barrels in the early 1970s before falling by more than half, to 19 billion, in 2008. In the years since, proved reserves have spiked to above 44 billion barrels as new extraction techniques have taken hold, and as of 2021, proved reserves sit at just over 41 billion barrels.
Some states have seen greater effects from the recent boom in oil production than others. Texas has seen a 32.4% increase in the size of its proved oil reserves over the last five years, further cementing its place as the top oil state in the U.S. With over 17 billion barrels of proved oil reserves, Texas now has more than three times the total of the next-highest state, New Mexico (4.5 billion). But some other states have also been rapidly climbing up the list of major oil producers, with states like Alaska (98.9% increase over the last five years) and Ohio (176.3% increase) seeing dramatic growth in the size of their reserves due to improvements in production.
Below is a complete breakdown of oil reserve data across all 50 states. The analysis was conducted by researchers at Construction Coverage, a website that compares construction software and insurance, using data from the U.S. Energy Information Administration. For more information, refer to the methodology section.

Photo Credit: ehrlif / Shutterstock
15. Michigan
- Crude oil proved reserves (million barrels): 53
- 5-year change in proved reserves (percent): +3.9%
- 5-year change in proved reserves (million barrels): +2
- Number of operating refineries: 1
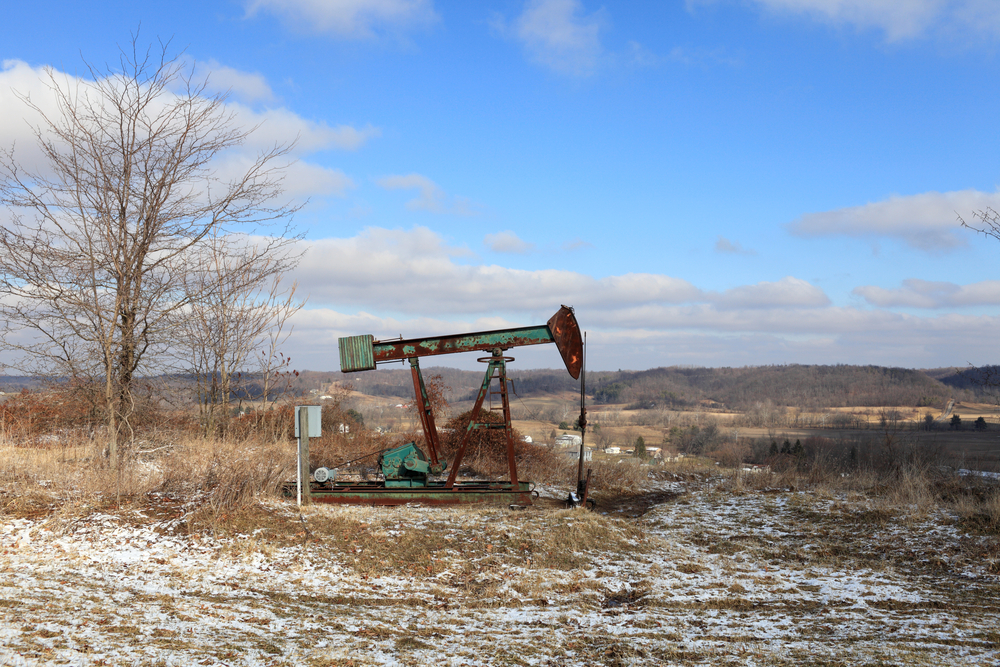
Photo Credit: Chubykin Arkady / Shutterstock
14. Ohio
- Crude oil proved reserves (million barrels): 105
- 5-year change in proved reserves (percent): +176.3%
- 5-year change in proved reserves (million barrels): +67
- Number of operating refineries: 4
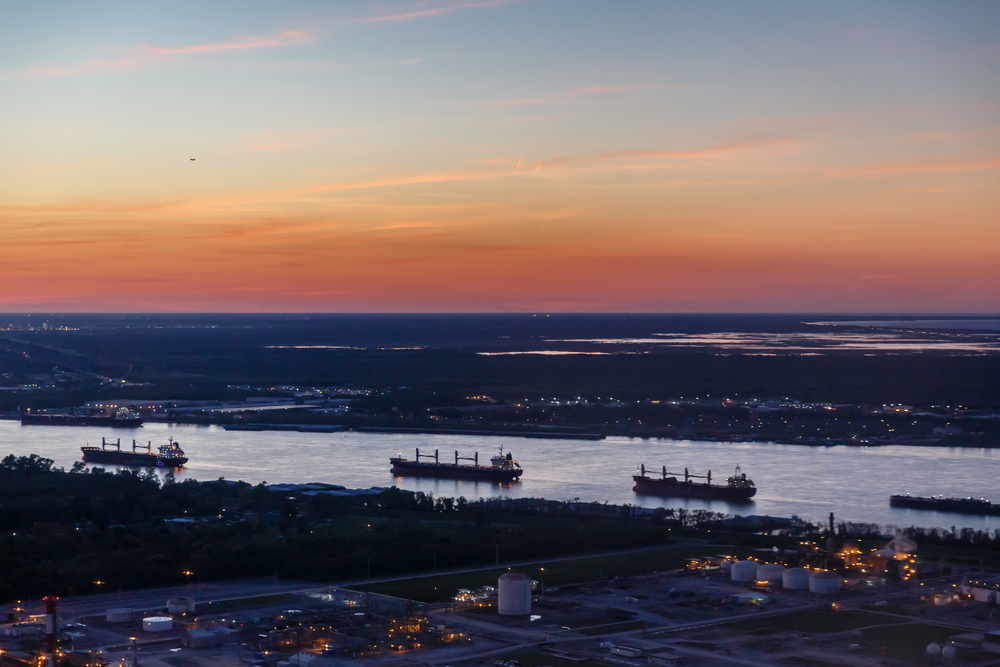
Photo Credit: Pete Niesen / Shutterstock
13. Mississippi
- Crude oil proved reserves (million barrels): 119
- 5-year change in proved reserves (percent): -5.6%
- 5-year change in proved reserves (million barrels): -7
- Number of operating refineries: 3
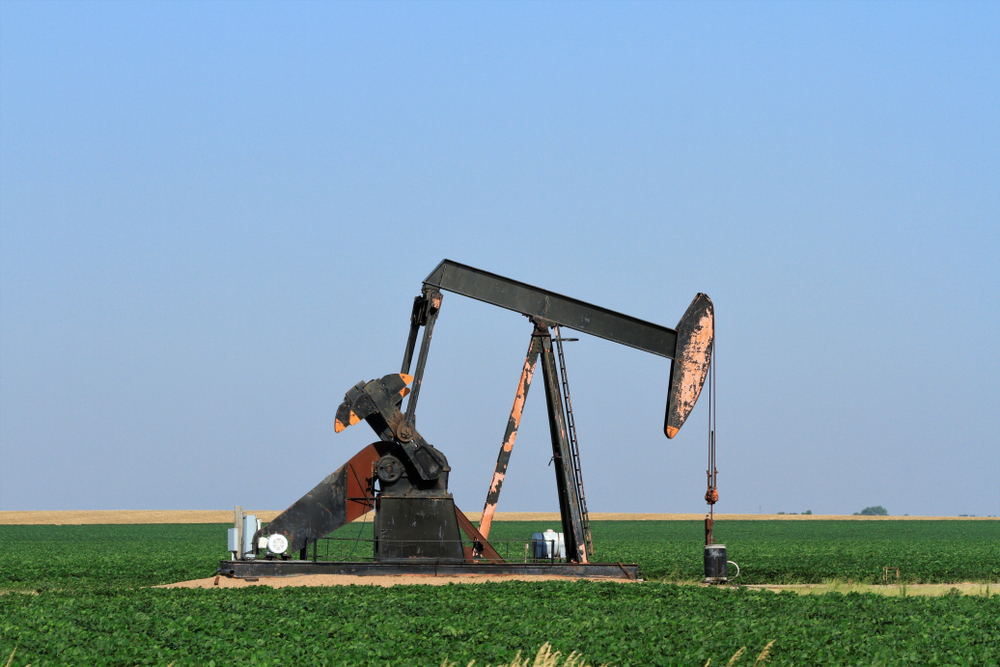
Photo Credit: Robert D Brozek / Shutterstock
12. Kansas
- Crude oil proved reserves (million barrels): 292
- 5-year change in proved reserves (percent): -18.4%
- 5-year change in proved reserves (million barrels): -66
- Number of operating refineries: 3
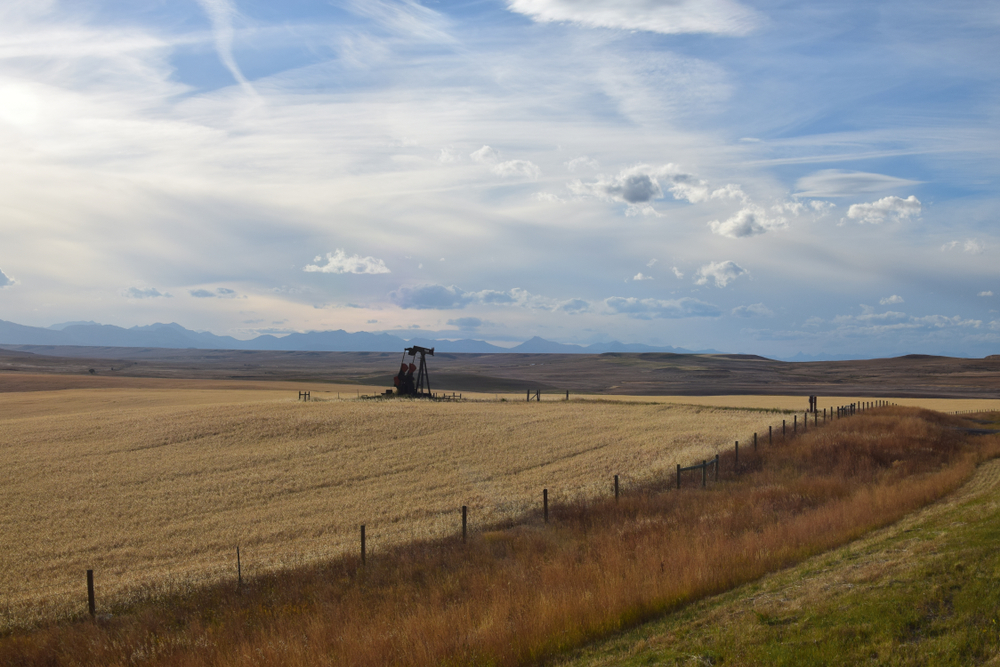
Photo Credit: Rui Serra Maia / Shutterstock
11. Montana
- Crude oil proved reserves (million barrels): 316
- 5-year change in proved reserves (percent): +10.9%
- 5-year change in proved reserves (million barrels): +31
- Number of operating refineries: 4
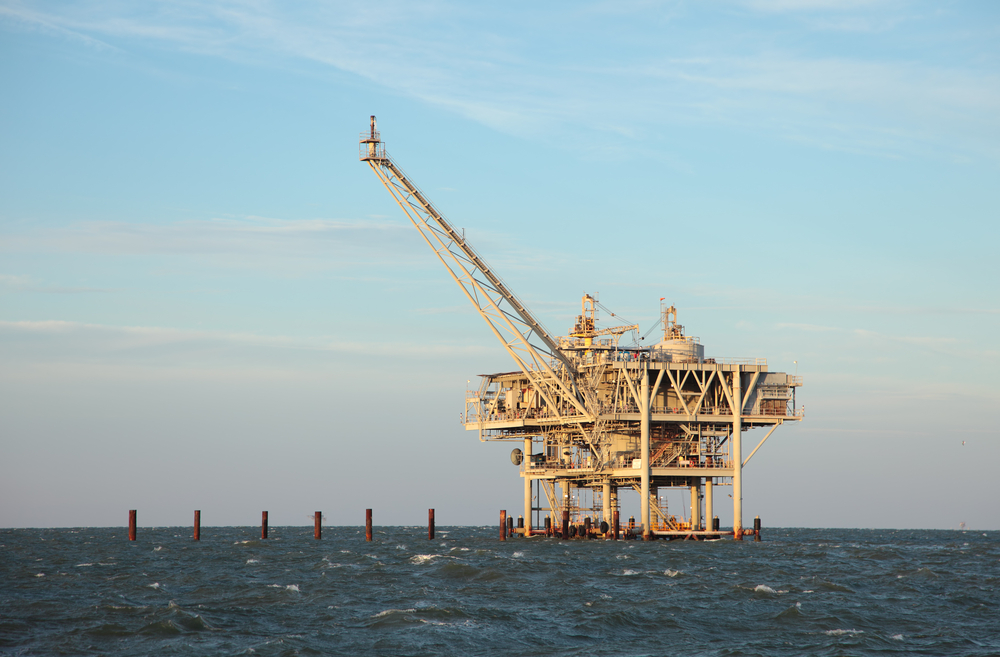
Photo Credit: robcocquyt / Shutterstock
10. Louisiana
- Crude oil proved reserves (million barrels): 365
- 5-year change in proved reserves (percent): -10.5%
- 5-year change in proved reserves (million barrels): -43
- Number of operating refineries: 15
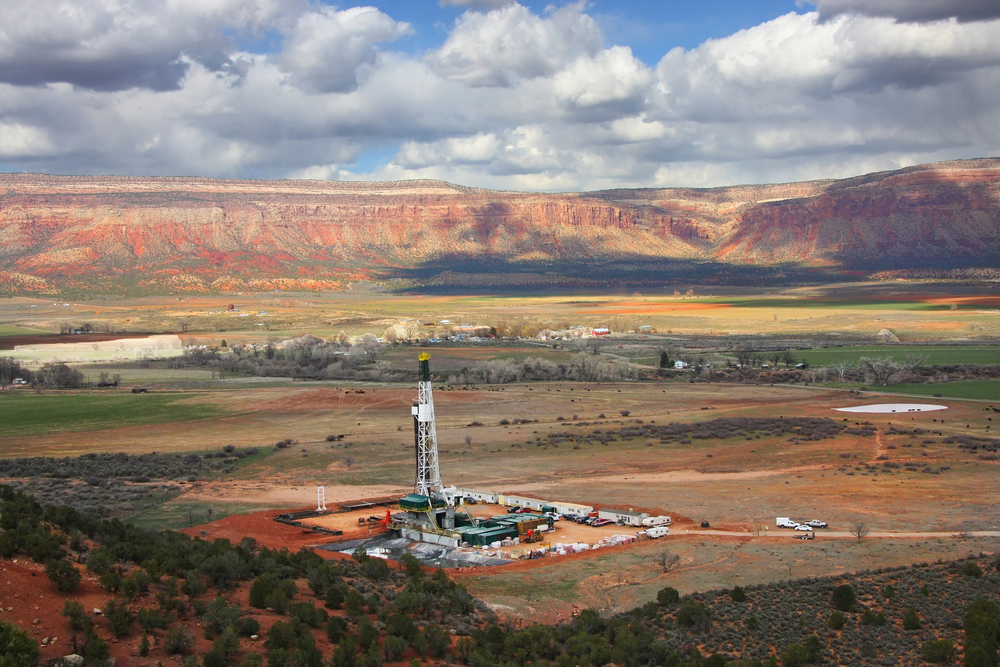
Photo Credit: Mark Smith / Shutterstock
9. Utah
- Crude oil proved reserves (million barrels): 530
- 5-year change in proved reserves (percent): +42.5%
- 5-year change in proved reserves (million barrels): +158
- Number of operating refineries: 5
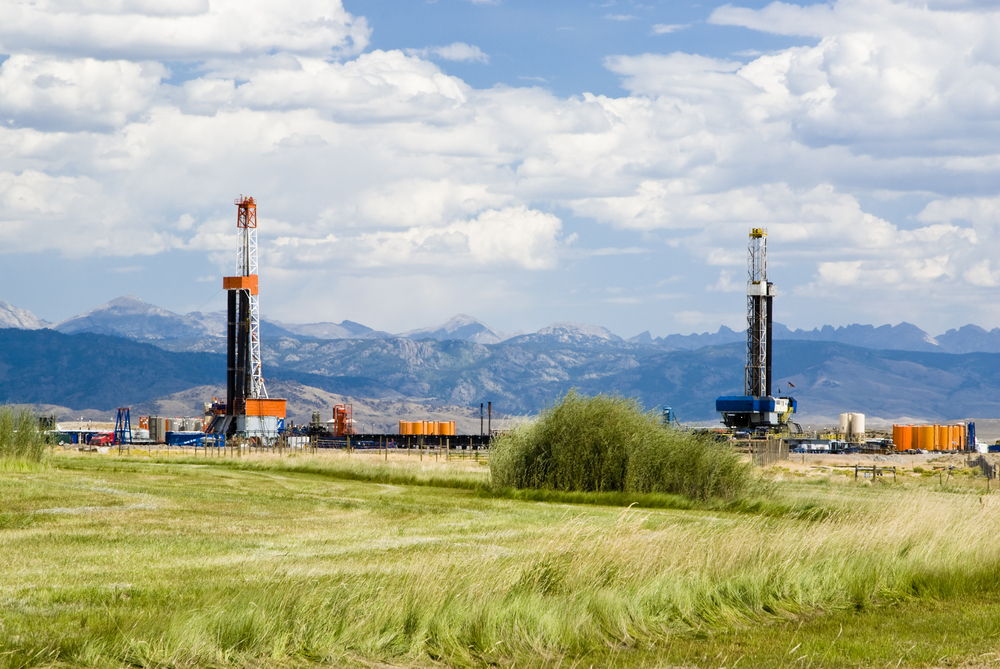
Photo Credit: Jim Parkin / Shutterstock
8. Wyoming
- Crude oil proved reserves (million barrels): 978
- 5-year change in proved reserves (percent): +23.6%
- 5-year change in proved reserves (million barrels): +187
- Number of operating refineries: 4
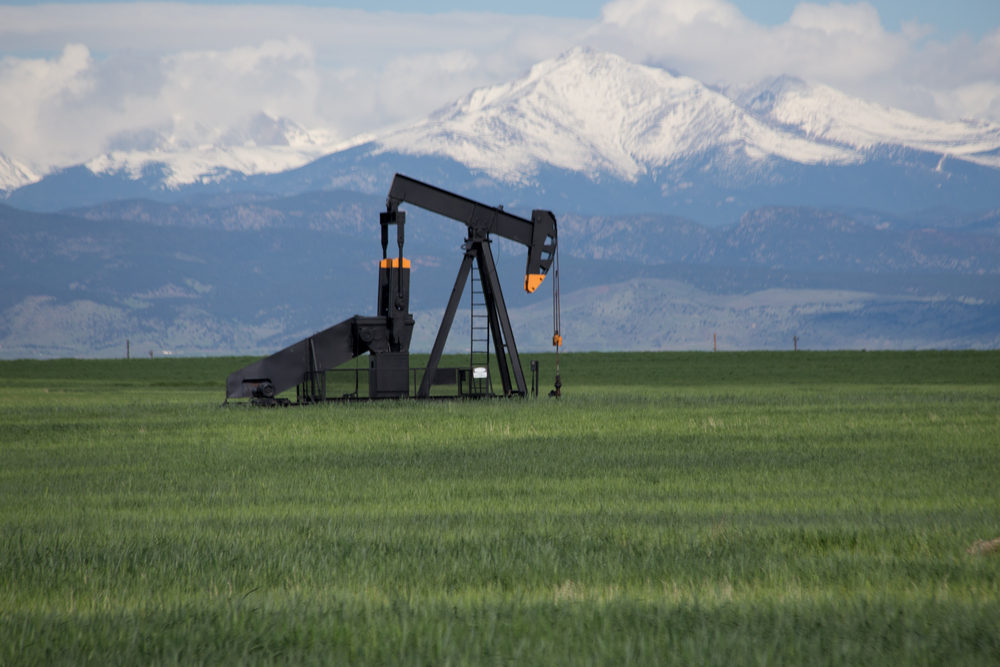
Photo Credit: Bridget Calip / Shutterstock
7. Colorado
- Crude oil proved reserves (million barrels): 1,469
- 5-year change in proved reserves (percent): +15.9%
- 5-year change in proved reserves (million barrels): +202
- Number of operating refineries: 2
Photo Credit: Vineyard Perspective / Shutterstock
6. Oklahoma
- Crude oil proved reserves (million barrels): 1,474
- 5-year change in proved reserves (percent): -12.9%
- 5-year change in proved reserves (million barrels): -219
- Number of operating refineries: 5
Photo Credit: Richard Thornton / Shutterstock
5. California
- Crude oil proved reserves (million barrels): 1,716
- 5-year change in proved reserves (percent): -11.2%
- 5-year change in proved reserves (million barrels): -217
- Number of operating refineries: 14
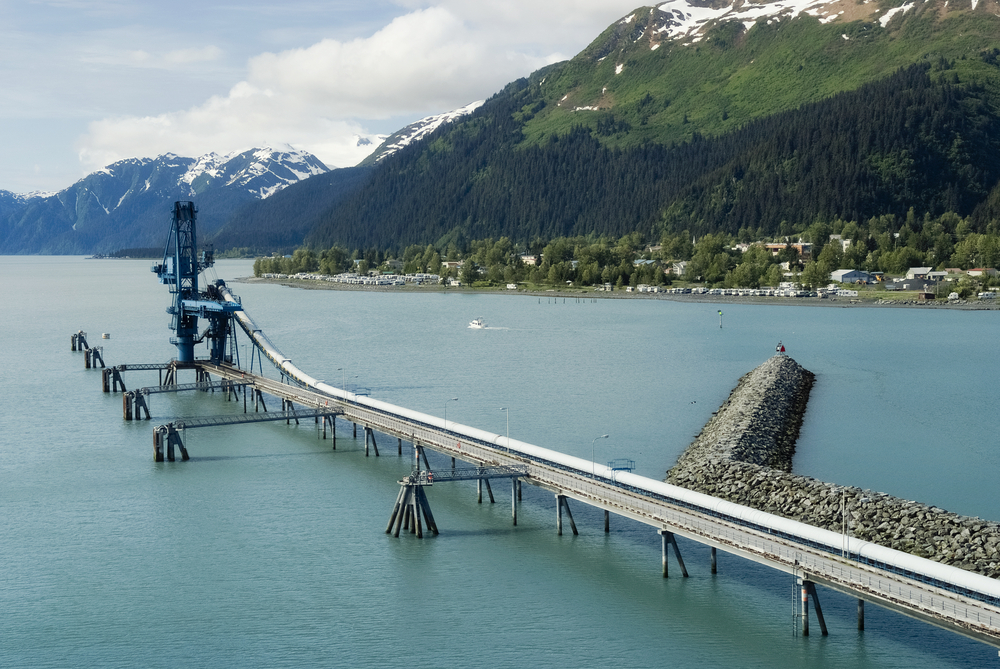
Photo Credit: dani3315 / Shutterstock
4. Alaska
- Crude oil proved reserves (million barrels): 3,127
- 5-year change in proved reserves (percent): +98.9%
- 5-year change in proved reserves (million barrels): +1,555
- Number of operating refineries: 5
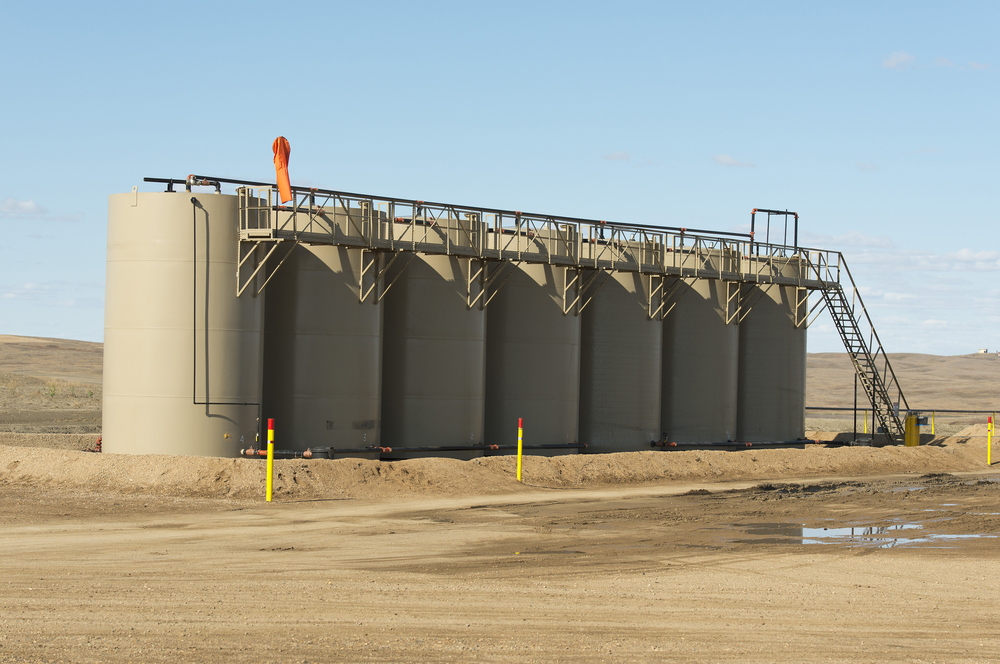
Photo Credit: Steve Oehlenschlager / Shutterstock
3. North Dakota
- Crude oil proved reserves (million barrels): 4,353
- 5-year change in proved reserves (percent): -17.2%
- 5-year change in proved reserves (million barrels): -903
- Number of operating refineries: 1
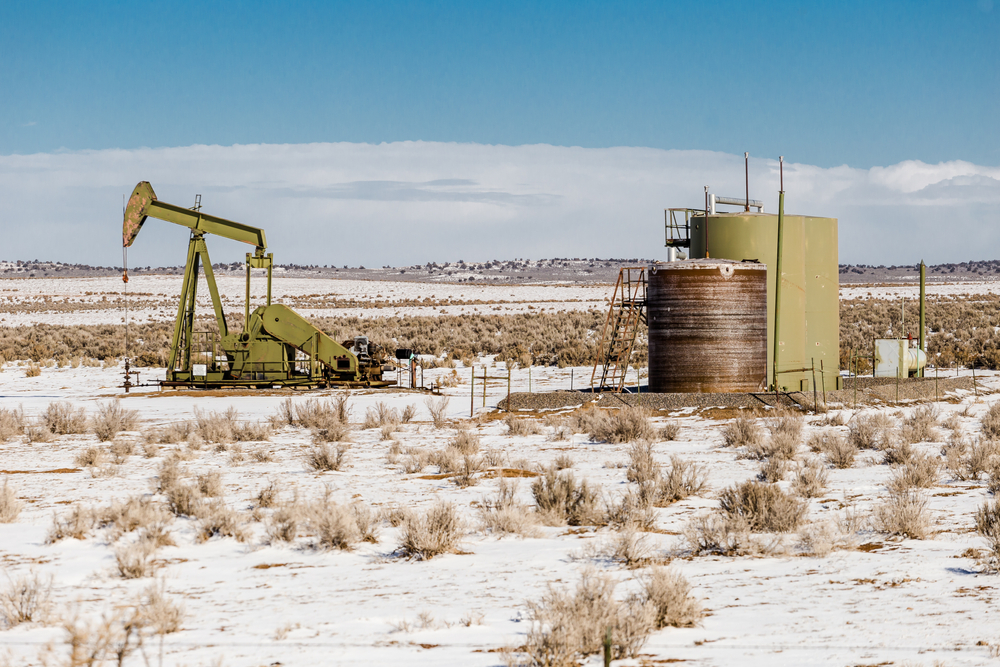
Photo Credit: R. Wellen Photography / Shutterstock
2. New Mexico
- Crude oil proved reserves (million barrels): 4,517
- 5-year change in proved reserves (percent): +191.6%
- 5-year change in proved reserves (million barrels): +2,968
- Number of operating refineries: 1
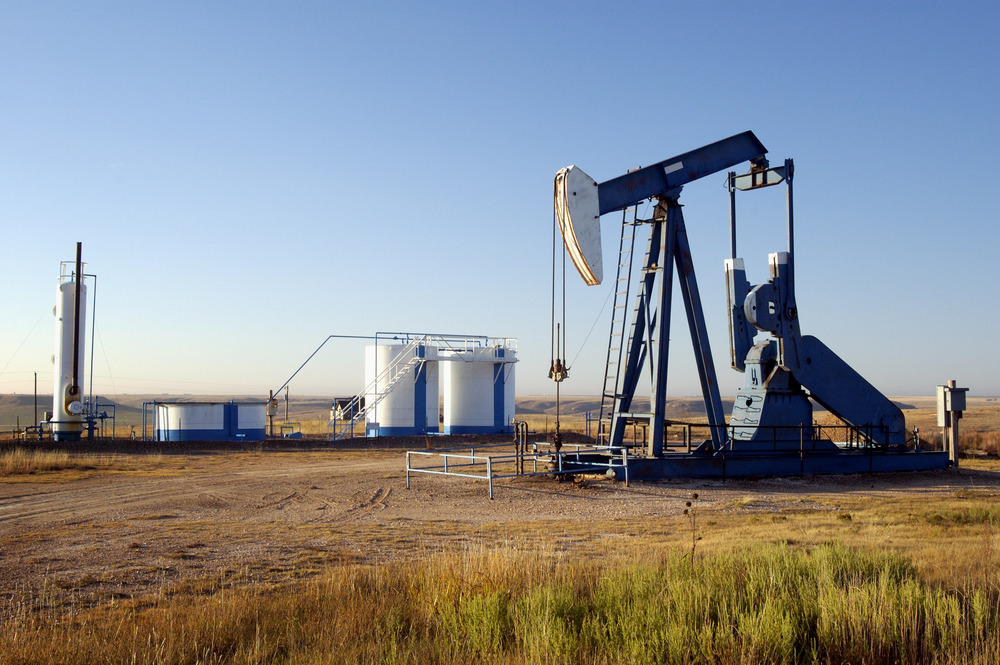
Photo Credit: Jim Parkin / Shutterstock
1. Texas
- Crude oil proved reserves (million barrels): 17,031
- 5-year change in proved reserves (percent): +32.4%
- 5-year change in proved reserves (million barrels): +4,172
- Number of operating refineries: 32
Methodology
Photo Credit: OlegRi / Shutterstock
Researchers analyzed data from the U.S. Energy Information Administration to determine the states with the most crude oil proved reserves as of 2021—the latest data available. For additional context, the five-year change in proved reserves, between 2016 and 2021, was calculated for each state. Researchers also extracted the number of operating refineries (as of 2023) in each state as a point of reference.
For complete results, see States With the Most Oil Reserves on Construction Coverage.


