
Photo Credit: Minerva Studio / Shutterstock
Severe weather conditions can spawn tornadoes—violently rotating air columns often extending from thunderstorms and reaching the ground. In extreme conditions, these destructive forces can inflict significant damage on buildings and infrastructure, flip vehicles with ease, and generate deadly airborne debris.
While scientists are still researching the impact of climate change on tornado occurrences in the U.S., there is growing evidence that global warming is making extreme weather events more frequent or more intense. With February 2024 being the third-warmest February on record, Americans living in areas routinely impacted by tornadoes will need to be vigilant during the 2024 tornado season.
U.S. Tornado Intensity Over Time
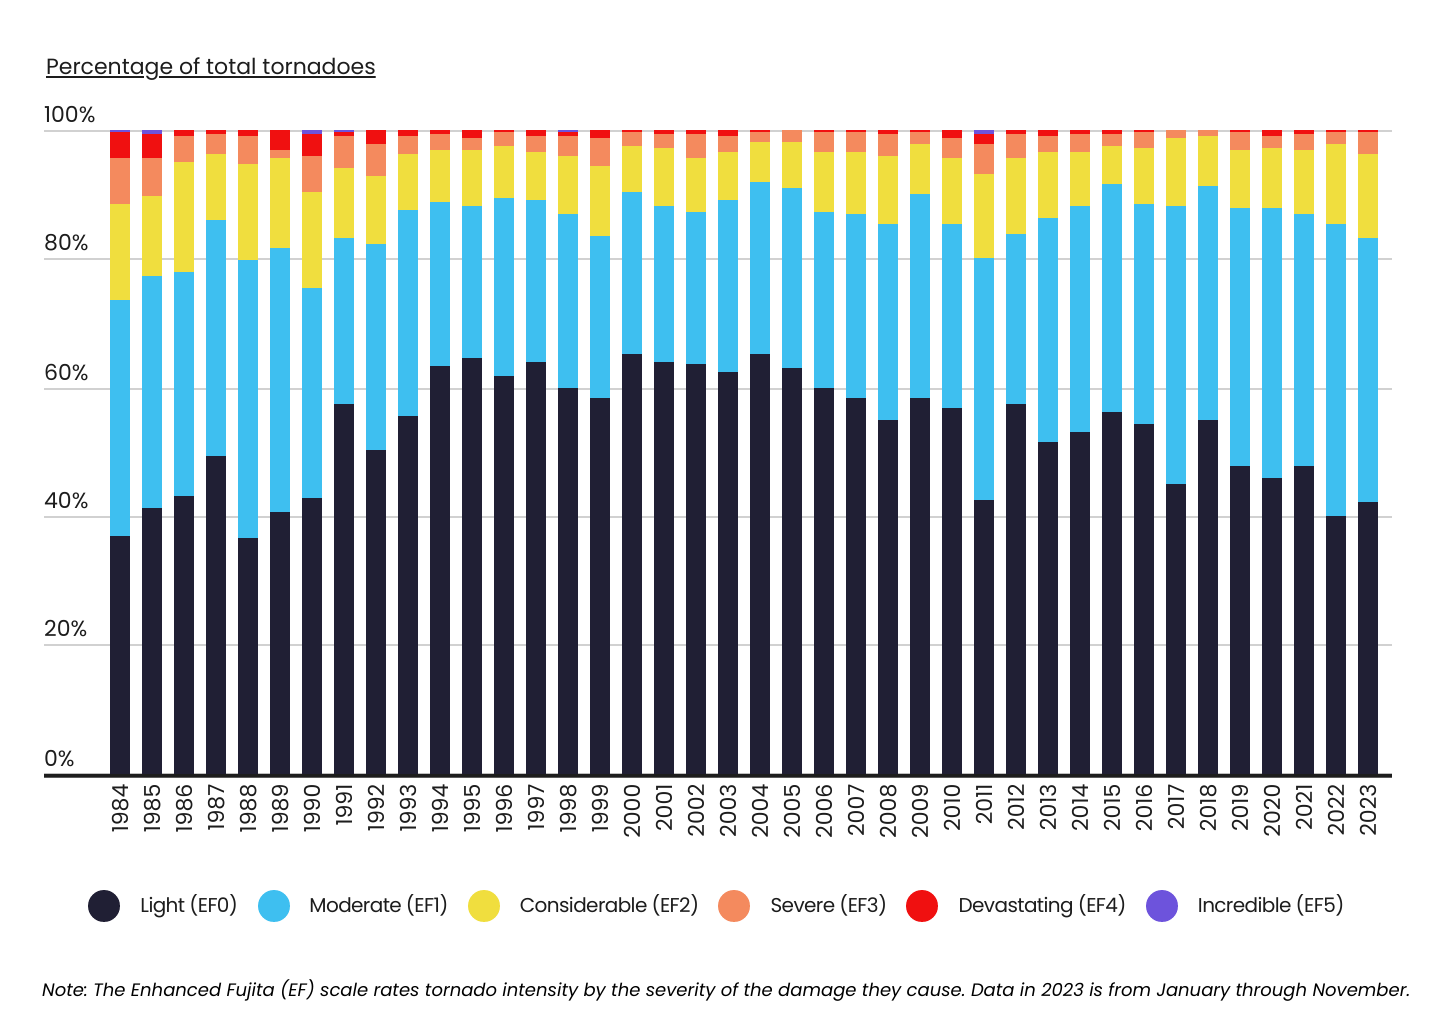
While tornado occurrences regularly top 1,000 each year, over 80% of them are considered light or moderate
Source: Captain Experiences analysis of National Oceanic and Atmospheric Administration (NOAA) data | Image Credit: Captain Experiences
Tornado formation requires atmospheric energy—typically from warm, unstable air out of the Gulf of Mexico—and significant wind shear—or changes in wind speed and direction between the ground and atmosphere. And although high-intensity tornado occurrences have the potential for more destruction, the vast majority of tornadoes in the U.S. are considered light or moderate.
“Weak” tornadoes—those rated EF0 or EF1 on the Enhanced Fujita (EF) Scale—accounted for 83.3% of all tornado occurrences in 2023 and topped 80% every year since 1989. High-intensity tornadoes, or those rated EF2 or higher, were much less frequent. EF2 (13.0%) and EF3 (3.5%) tornadoes were the next most common occurrences, while there were only two EF4 and no EF5 occurrences in 2023.
Contributions to Human Casualties and Property Damage by Tornado Intensity
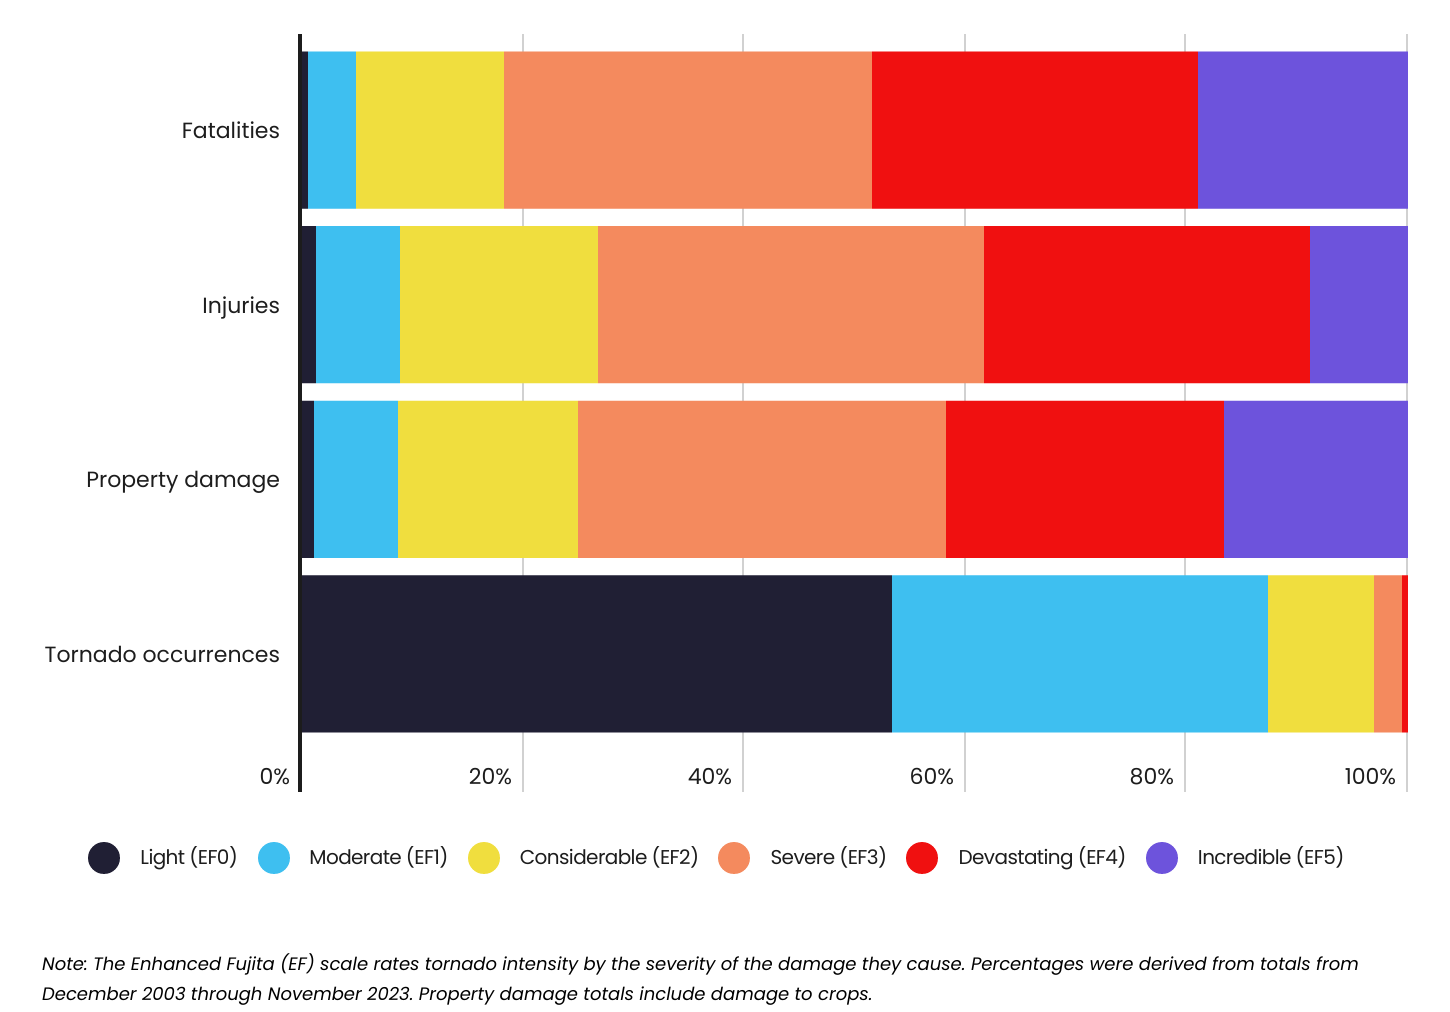
Despite making up less than 13% of all tornadoes, EF2+ tornadoes account for over 90% of tornado-related fatalities, injuries, and damage
Source: Captain Experiences analysis of National Oceanic and Atmospheric Administration (NOAA) data | Image Credit: Captain Experiences
Although low-intensity tornadoes are the most common, high-intensity tornadoes are the most destructive. During the 20-year period ending in November 2023, tornadoes classified as EF2 through EF5 accounted for less than 13% of all occurrences but were responsible for 95.1% of fatalities, 91.2% of injuries, and 91.3% of property damage. While tornadoes can inflict direct casualties through high winds and debris, causing injury or death especially for those in mobile homes, the elderly, or those lacking shelter, their indirect impacts can also be substantial. Damage to critical infrastructure like power lines can significantly disrupt access to essential services and supplies, leading to further health and economic consequences.
Geographical Changes in High-Intensity Tornado Occurrences
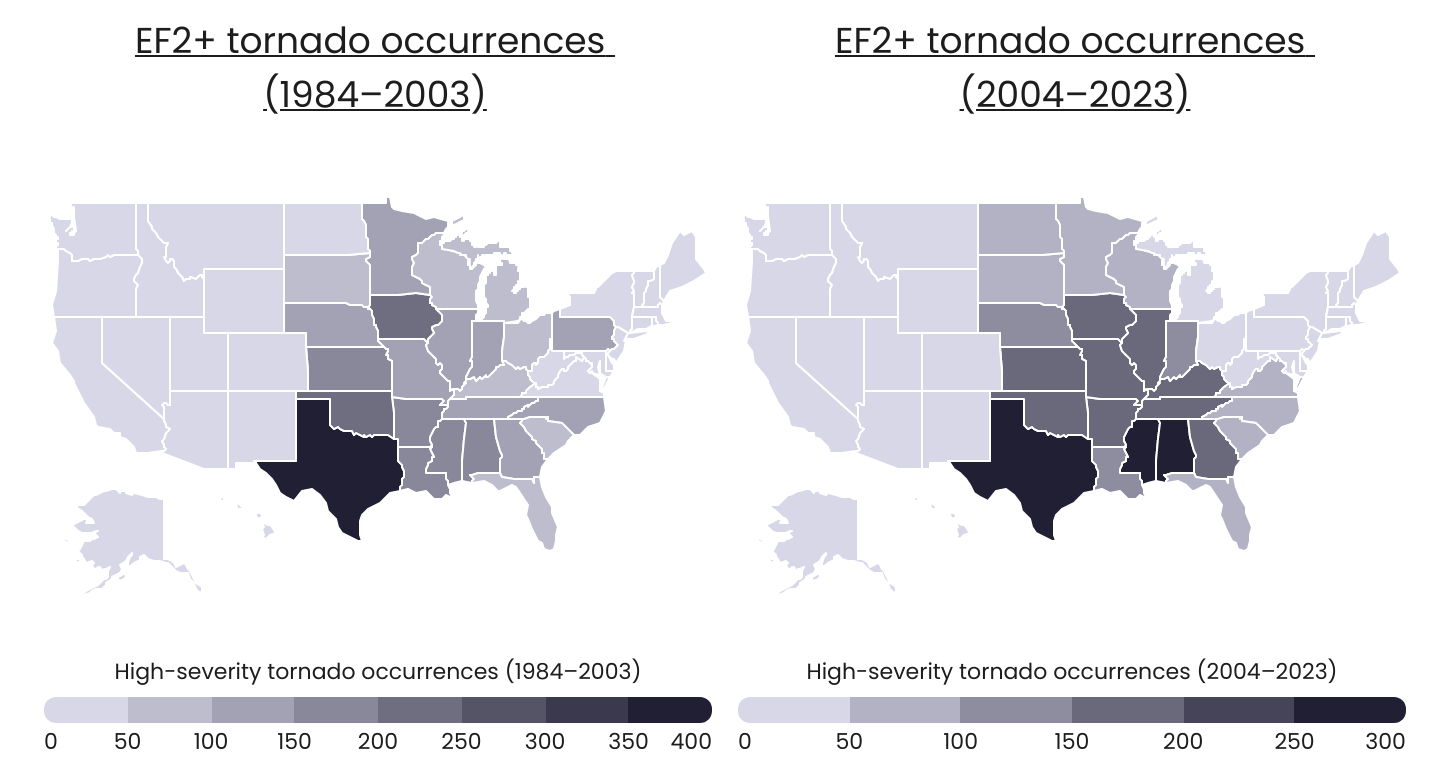
Over the past 20 years, high-intensity tornados have spread farther into the Southeast and Midwest
Source: Captain Experiences analysis of National Oceanic and Atmospheric Administration (NOAA) data | Image Credit: Captain Experiences
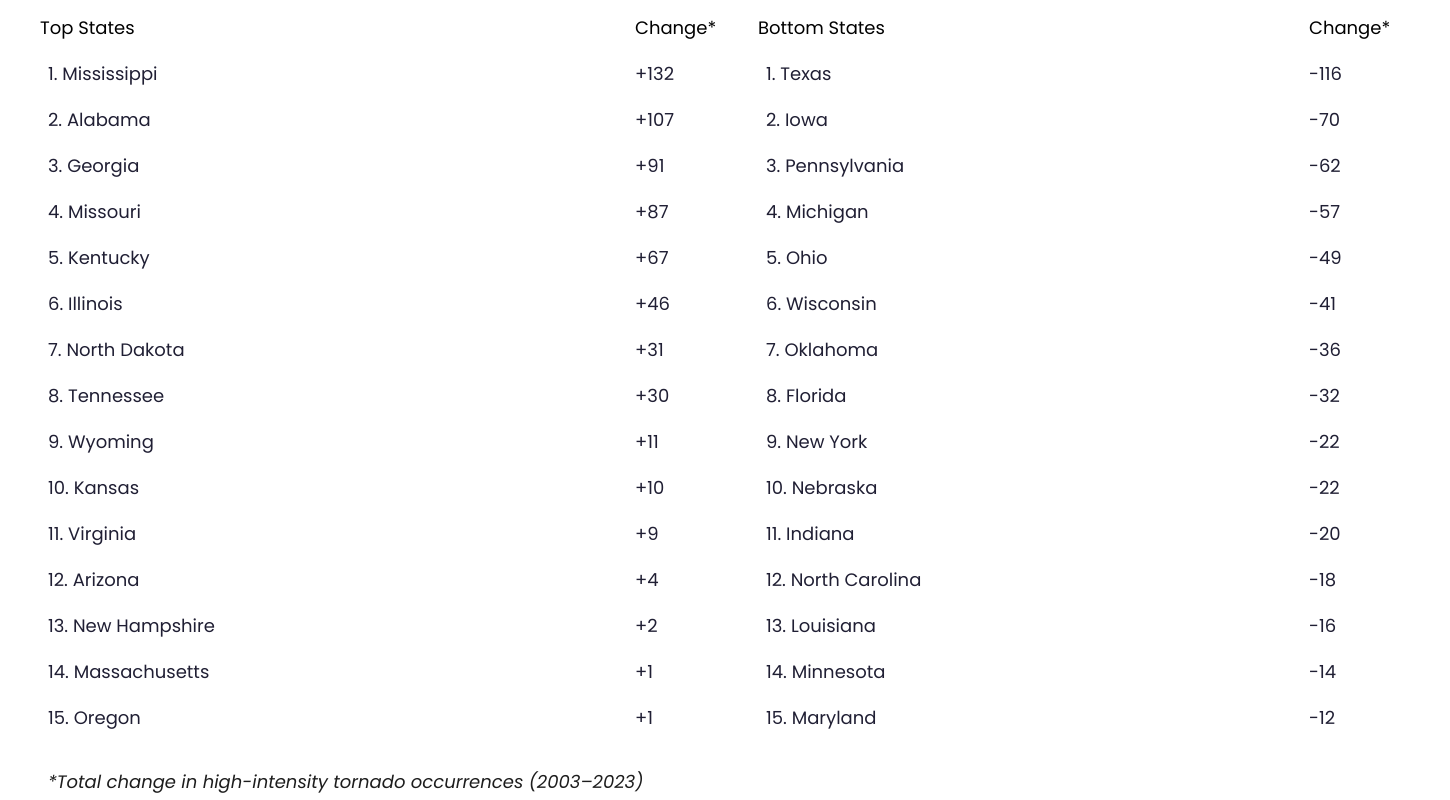
Historically, areas including Texas, Oklahoma, Kansas, and their surrounding regions—also known as Tornado Alley—have been most impacted by tornadoes. During the 20-year span ending in November 2003, Texas experienced the most EF2+ tornadoes with 395 of them touching down in the Lone Star State, followed by Oklahoma (226), Iowa (222), and Arkansas (194).
However, the next two decades saw a notable shift in tornado geography. Although Tornado Alley was still heavily frequented with tornado occurrences, areas in the Southeast experienced sizable increases. Mississippi led all states with 303 EF2+ tornado occurrences during that span, a more than 77% increase from the prior 20-year period. Similarly, Alabama (277) and Georgia (194) saw the third and fifth most EF2+ tornadoes, respectively, both translating to increases of over 60%.
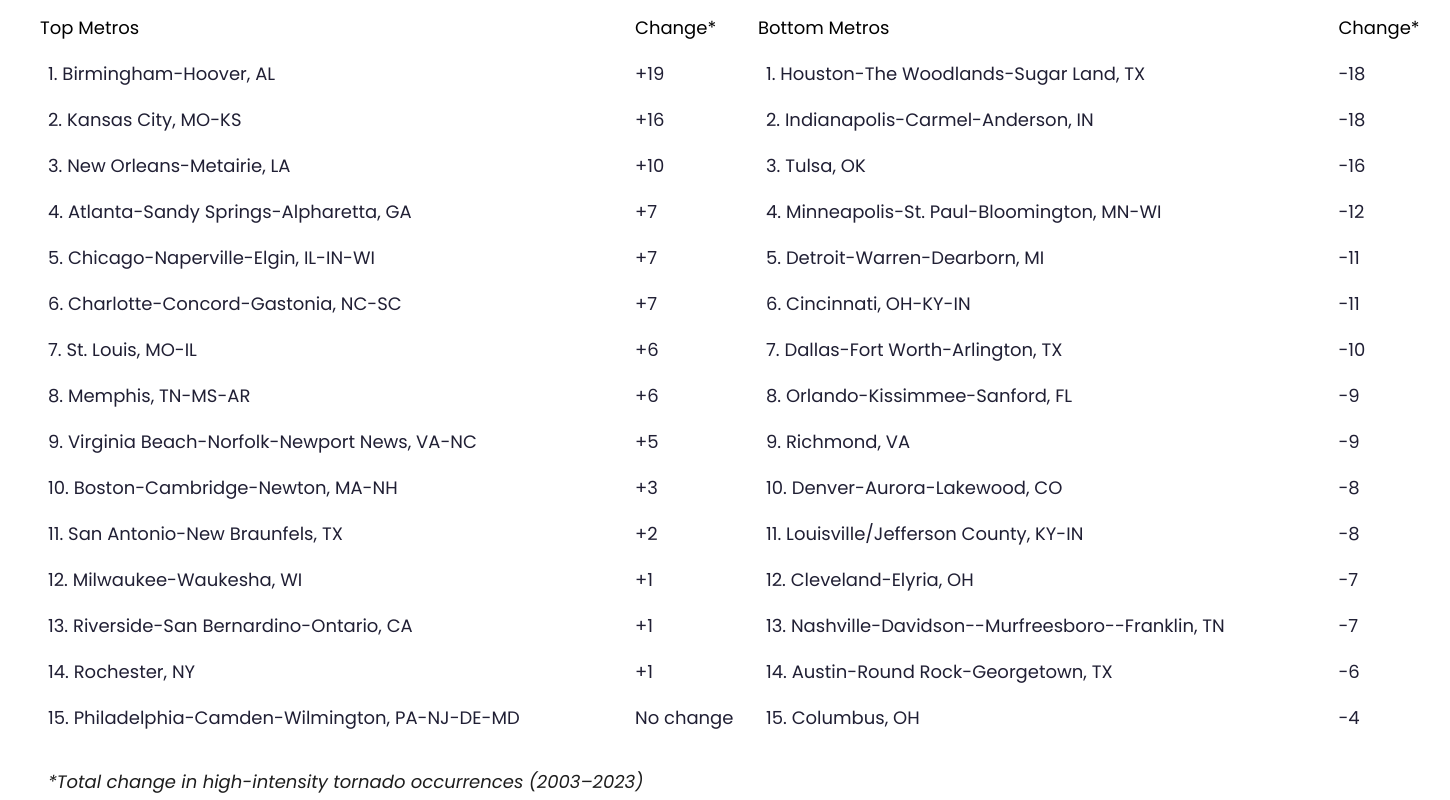
This pronounced shift eastward to “Dixie Alley”—or the area roughly stretching from eastern Texas to the western borders of the Carolinas—is mirrored at the metropolitan level. Over the past two decades, the Birmingham-Hoover, AL and Hattiesburg, MS metro areas observed the most substantial increases in high-intensity tornadoes, recording an additional 19 and 18 EF2+ tornadoes, respectively. In contrast, despite enduring double-digit tornado occurrences over the same period, the Houston-The Woodlands-Sugar Land, TX and Indianapolis-Carmel-Anderson, IN metros each experienced a decrease of 18 EF2+ tornadoes.
Below is a complete breakdown of 384 metropolitan areas and all 50 states for the locations with the biggest increase in high-intensity tornadoes. Researchers at Captain Experiences conducted the analysis using data from the National Oceanic and Atmospheric Administration (NOAA). For more information on how each statistic was computed, refer to the methodology section below.
Large Metros With the Biggest Increase in High-Intensity Tornadoes
Midsize Metros With the Biggest Increase in High-Intensity Tornadoes
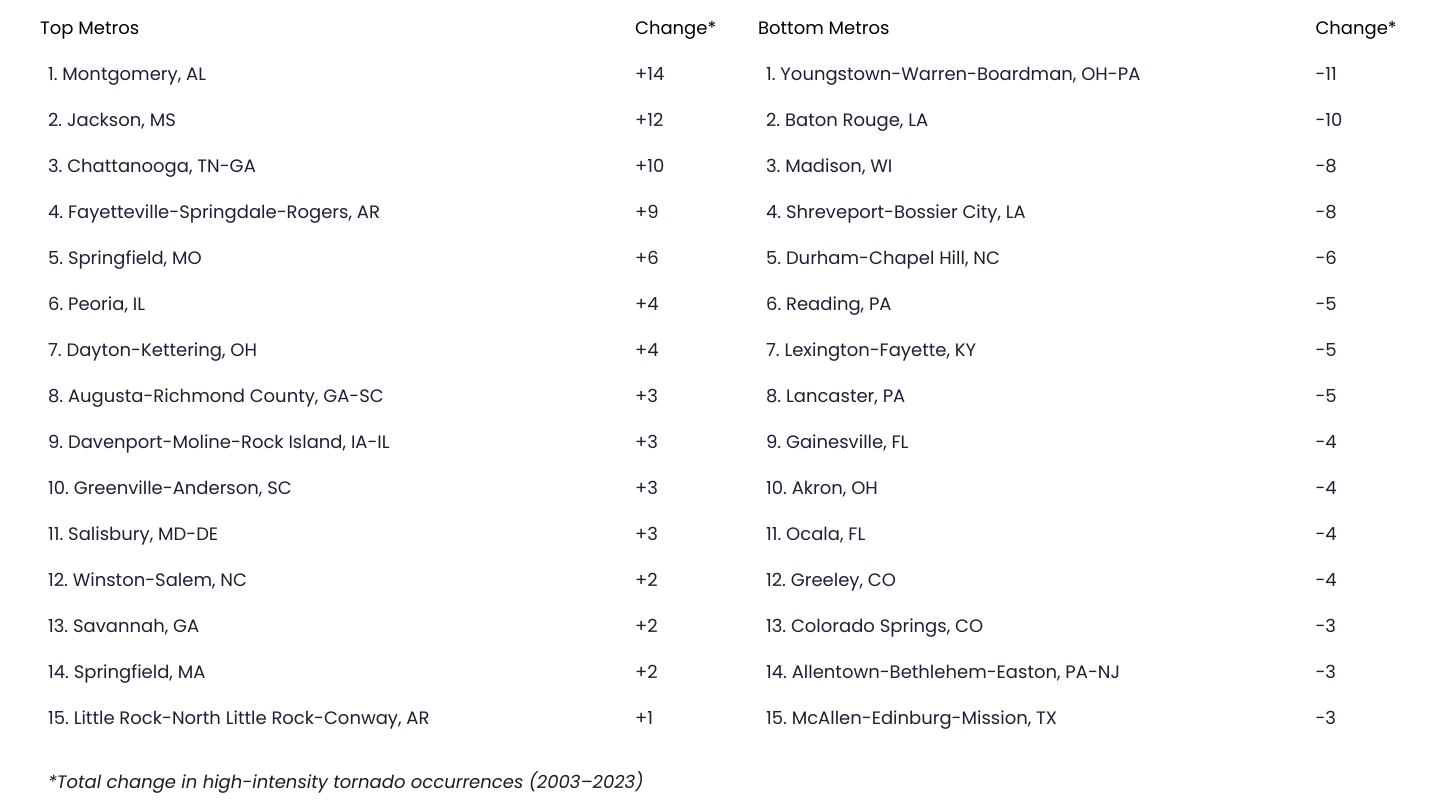
Small Metros With the Biggest Increase in High-Intensity Tornadoes

States With the Biggest Increase in High-Intensity Tornadoes
Methodology
Photo Credit: Minerva Studio / Shutterstock
The data used in this analysis is from the National Oceanic and Atmospheric Administration’s (NOAA) Storm Events Database. The researchers ranked locations by the total change in high-intensity tornado occurrences from the 20-year period ending in November 2004 to the 20-year period ending in November 2023. High-intensity tornadoes were considered to be those categorized as EF2 or higher on the Enhanced Fujita Scale. Tornado-related fatalities, injuries, and annual average damages were also calculated from December 2004 through November 2023. In the event of a tie, locations with the larger number of high-severity tornado occurrences during the 20-year period ending in November 2023 were ranked higher. Further ties were broken by tornado-related fatalities, injuries, and annual average damages, respectively.
For additional relevance, metropolitan areas were grouped into cohorts based on population size: small (less than 350,000), midsize (350,000–999,999), and large (1,000,000 or more).
For complete results, see Cities With the Biggest Increase in Tornadoes on Captain Experiences.


