
Photo Credit: Robert Crum / Shutterstock
America’s housing market has entered a period of recalibration after the frenzy of recent years. While the acute shortages and bidding wars have mostly cooled, affordability remains a stubborn challenge. Home prices are still hovering near record highs, though their growth has slowed significantly, now trailing general inflation on average rather than outpacing it. Meanwhile, interest rates have stabilized but remain elevated compared to historic lows, continuing to exert pressure on borrowing costs for aspiring buyers.
While existing homeowners have largely benefited from high prices in the form of equity gains, they also face their own set of challenges. For one, many are effectively “locked in” to their homes, having secured low-interest mortgages before rates began climbing. For these homeowners, relocating often means choosing between downsizing to a less expensive property or absorbing significantly higher monthly payments on a new loan.
Another factor is property taxes. Typically calculated as a percentage of a home’s assessed value, property taxes remain a growing burden even as the market cools. Because tax assessments often lag behind real-time market data, many homeowners are still seeing their bills climb as local governments play catch-up to the massive value spikes of the early 2020s. Consequently, even in a slower market, property tax bills in many areas continue to rise, squeezing homeowners regardless of whether they have a fixed-rate mortgage or own their property outright.
To address this issue, certain states have implemented mechanisms to protect homeowners from runaway tax increases. As of 2025, 18 states, including California, Florida, and New York, and the District of Columbia have assessment limits that cap how much a property’s assessed value can increase annually. While these limits help shield homeowners from the full impact of rising home prices, they also deter long-time owners from moving and contribute to significant disparities in property tax burdens across the U.S.
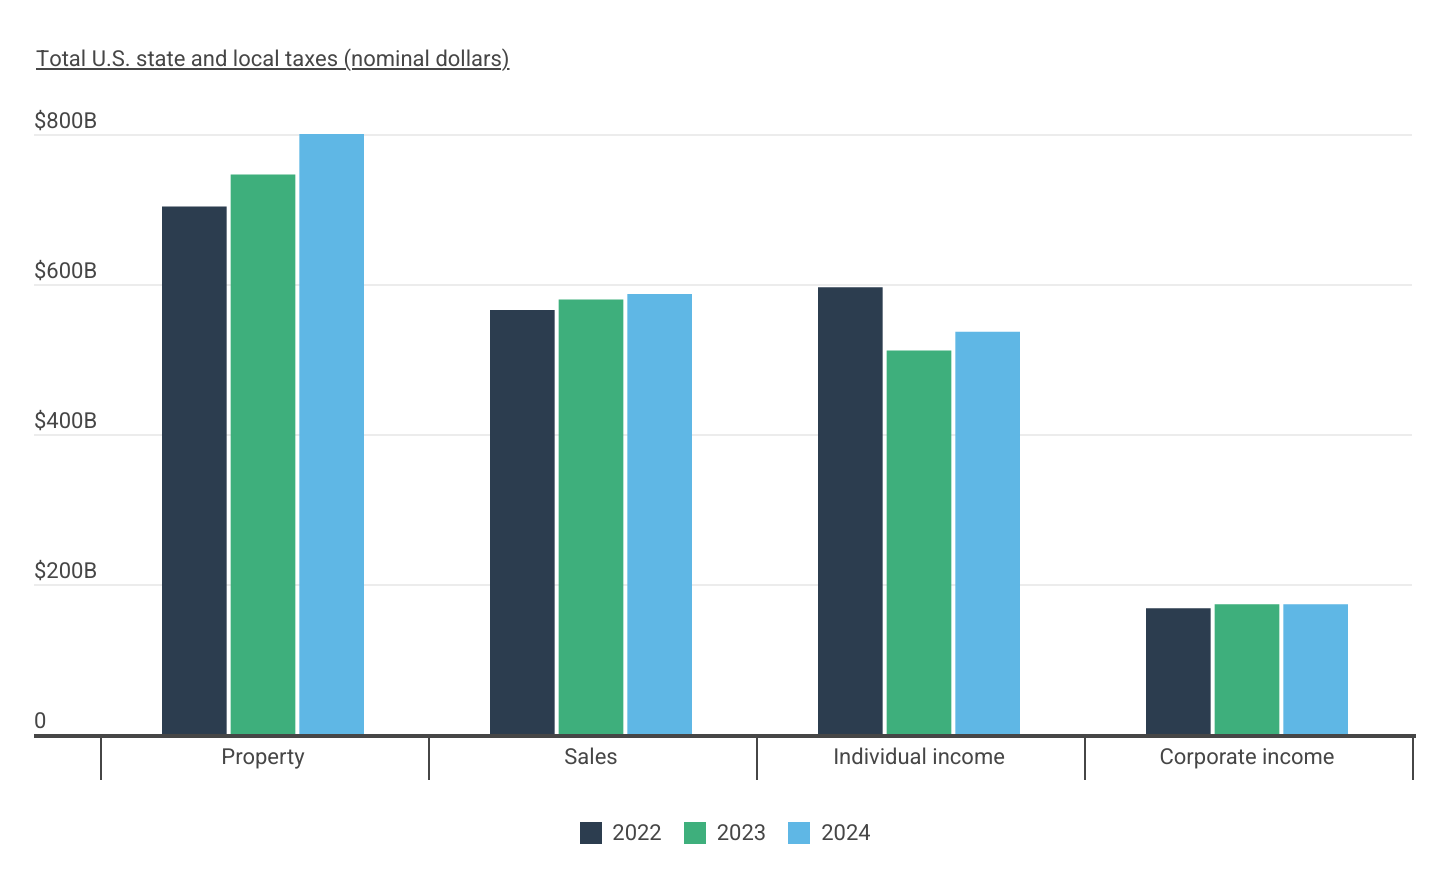
State and Local Tax Revenue by Source
Property taxes account for the largest share of state and local tax revenue and continue to grow
Source: Construction Coverage analysis of U.S. Census Bureau data | Image Credit: Construction Coverage
Higher property taxes can be daunting for homeowners, but they are a boon for state and local governments that rely heavily on property tax revenue. Property taxes are a cornerstone of state and local government finances, providing the largest share of tax revenue to fund essential services such as education, public safety, and infrastructure. Unlike other tax types, property taxes offer a relatively stable revenue stream, as they are less directly affected by economic fluctuations.
From 2022 to 2024, property taxes saw the largest total increase in revenue among major tax categories, rising by more than $96 billion (13.7%) from $703 billion to $800 billion. This outpaced the growth in sales tax revenue, which increased by just over $21 billion, and corporate income tax revenue, which grew by $5.3 billion. In contrast, individual income tax revenue declined by 10% from 2022 to 2024—a reduction of more than $59 billion—despite modest growth since 2023.
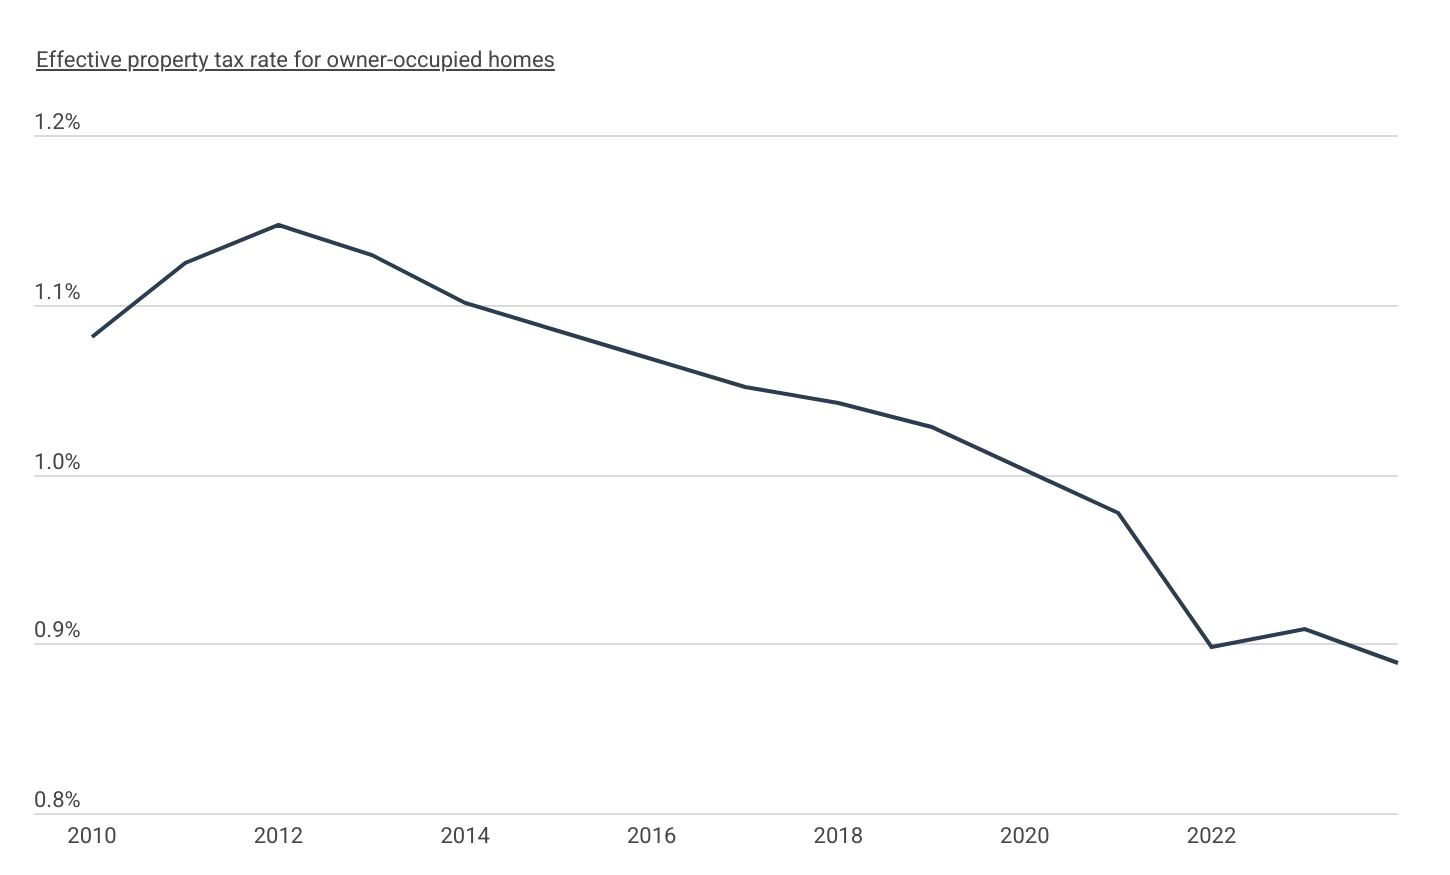
Effective Property Tax Rate for Owner-Occupied Homes
Rapid home appreciation has driven the effective tax rate below 1%
Source: Construction Coverage analysis of U.S. Census Bureau data | Image Credit: Construction Coverage
While homeowners might expect recent surges in home values to directly translate to higher property tax bills, the reality is more complex. Nationwide, the effective property tax rate—the total taxes paid as a percentage of the aggregate value of owner-occupied housing—has steadily declined over the past decade. After peaking at 1.147% in 2012, the effective rate fell to 0.898% in 2022, its lowest level in over a decade. Despite a brief rebound to 0.909% in 2023, the rate dropped again to 0.888% in 2024—remaining well below its peak—underscoring the persistent disconnect between rising home values and tax assessments.
This trend reflects the inherent lag in property tax systems, where assessments are typically updated periodically or when homes change ownership. The mismatch between rising property values and effective tax rates creates disparities in how tax burdens are distributed. Long-term homeowners often benefit from lower effective rates, while new buyers purchasing homes at higher market values may face disproportionately larger tax bills.
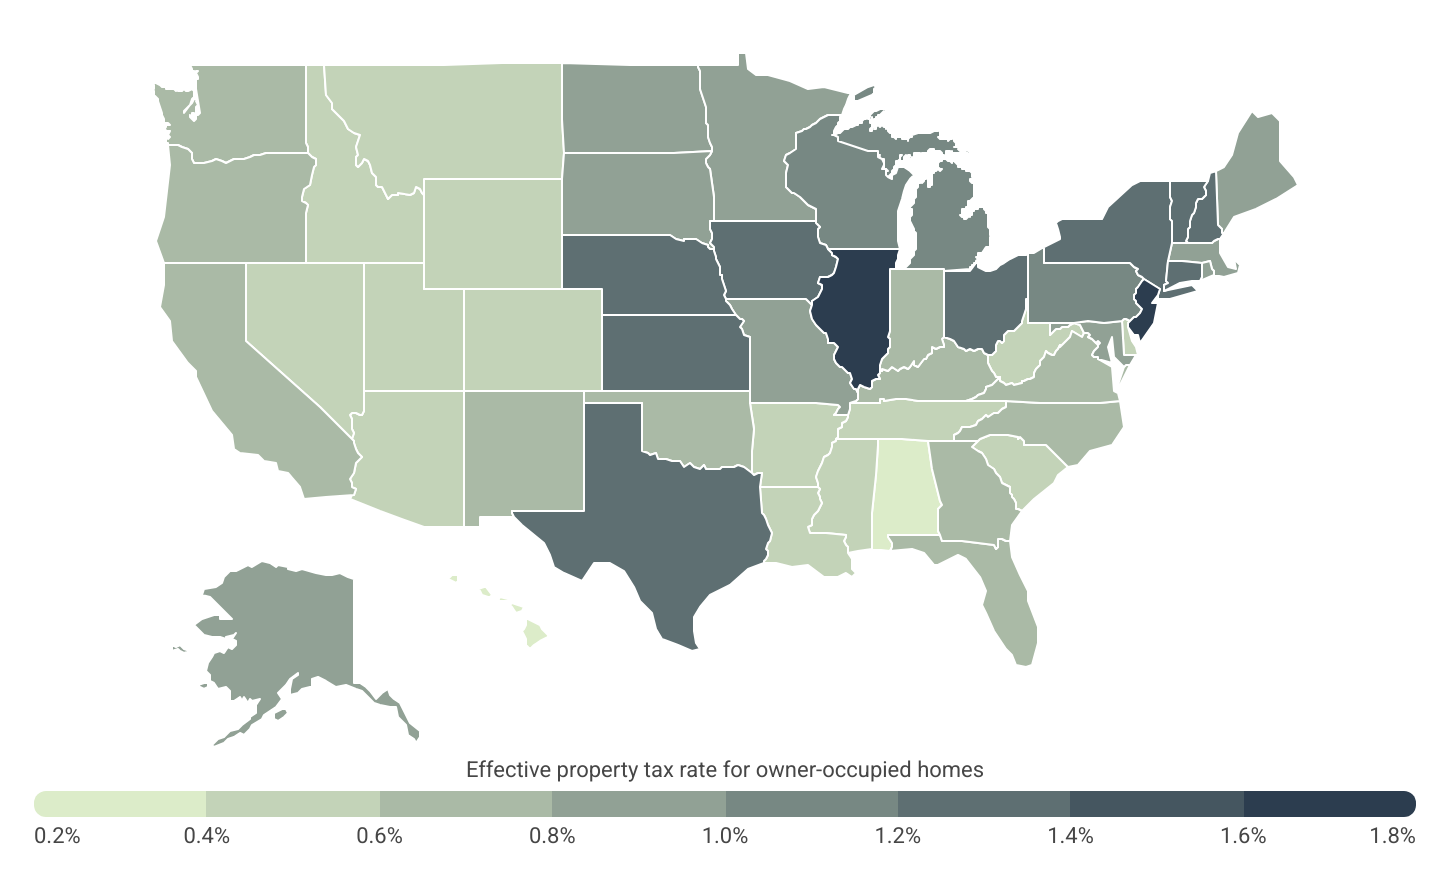
Effective Property Tax Rate by State
Midwest and Northeast states levy the highest rates, led by Illinois and New Jersey
Source: Construction Coverage analysis of U.S. Census Bureau data | Image Credit: Construction Coverage
Property tax burdens in the United States vary significantly depending on state, county, and city, reflecting a patchwork of overlapping state and local tax policies. This mosaic of property tax regimes creates wide disparities in effective tax rates across the country, with some regions experiencing markedly higher rates than others.
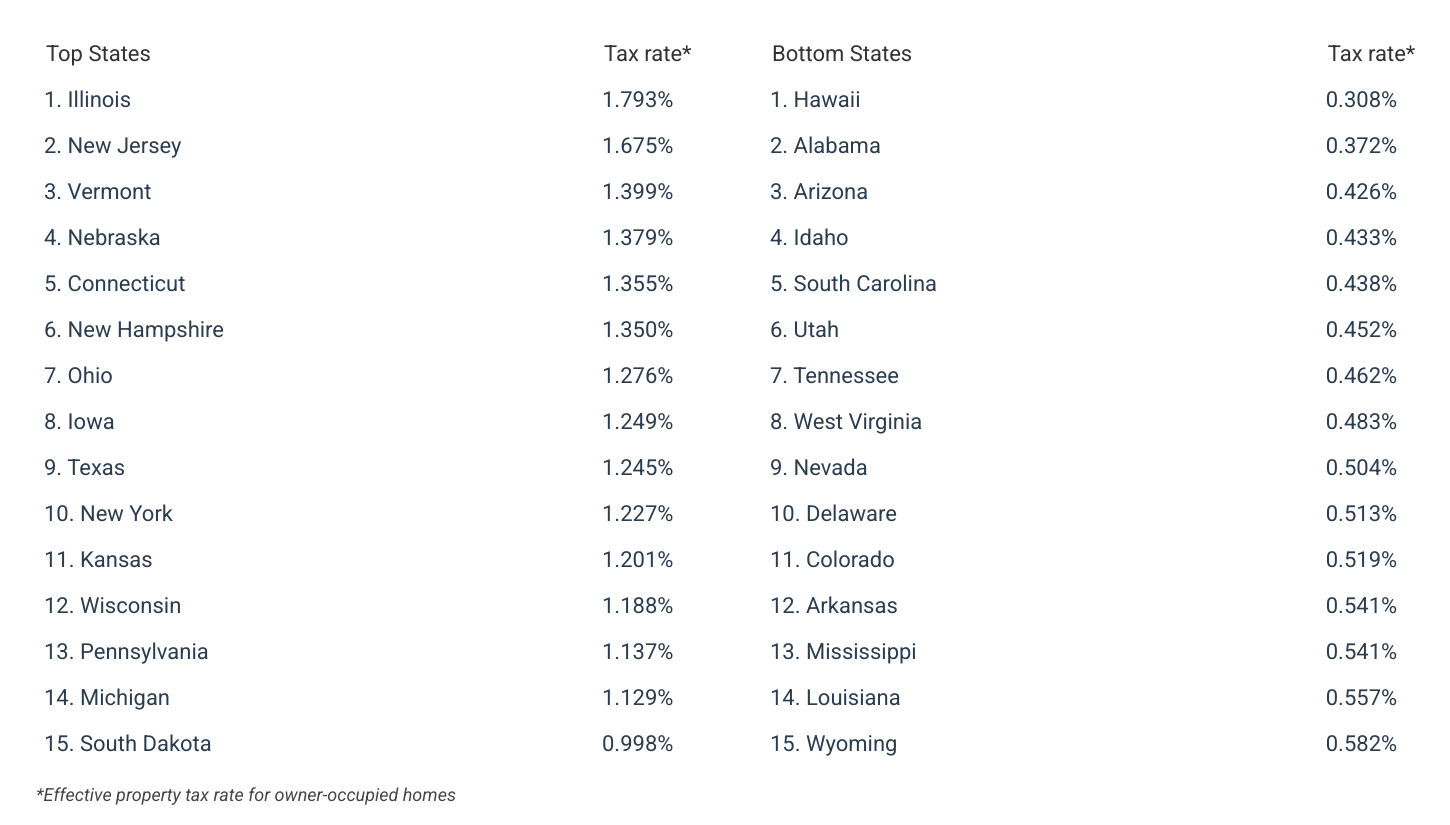
At the state level, the Northeast and Midwest lead with the highest effective property tax rates for owner-occupied homes. Illinois tops the list at 1.793%, followed closely by New Jersey at 1.675%. States like Vermont (1.399%), Nebraska (1.379%), and Connecticut (1.355%) also rank highly, reflecting a trend where densely populated or older, established states often require more revenue to support infrastructure and services. In contrast, the South and Mountain West regions generally have the lowest effective rates, with Alabama (0.372%) and South Carolina (0.438%) near the bottom, along with Arizona (0.426%) and Idaho (0.433%). A notable exception is Texas, which ranks ninth overall, with an effective property tax rate of 1.245%.
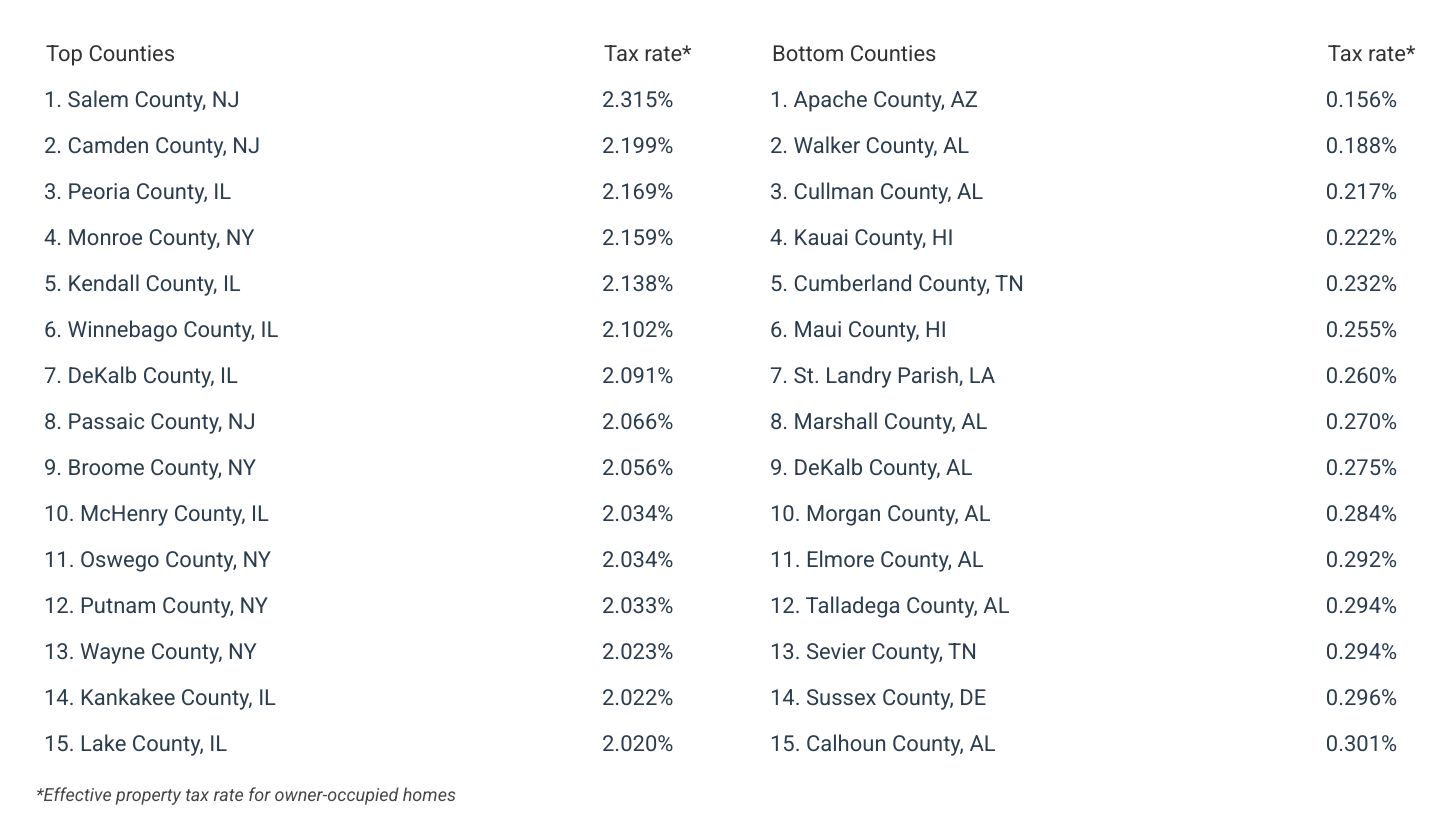
Drilling down to the county level, disparities are even more pronounced. Salem County, NJ has the highest effective tax rate in the country at 2.315%, followed by Camden County, NJ, at 2.199%. Other counties in New Jersey, as well as Illinois and New York dominate the top of the list. In fact, each of the 41 counties with the highest effective property taxes tracked in this analysis are located in one of those three states. Conversely, Apache County, AZ, boasts the lowest rate at 0.156%, with other counties in Alabama, Hawaii, and Tennessee rounding out the bottom tier.
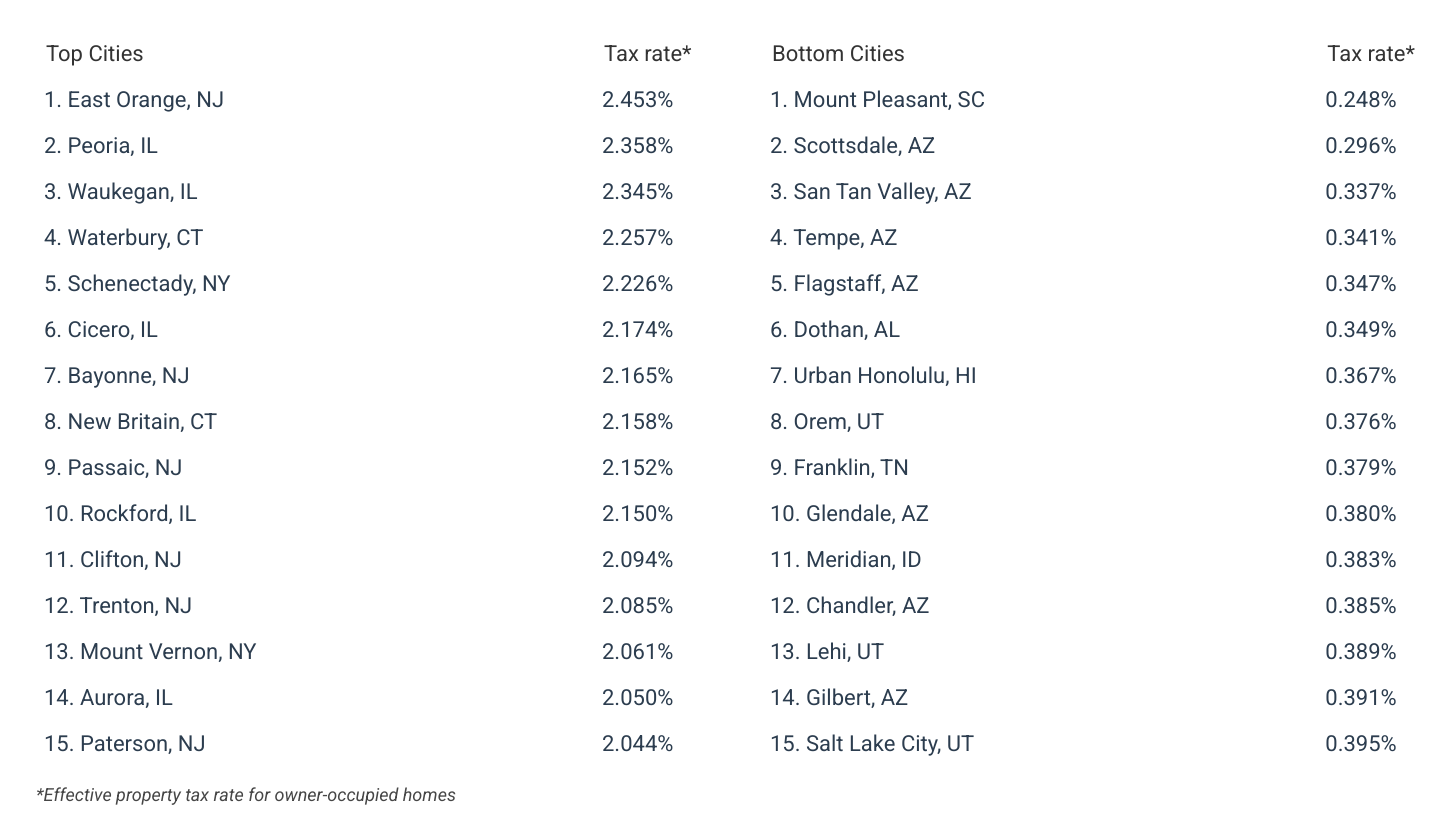
City-level differences also mirror these trends. East Orange, NJ, has the highest effective property tax rate of all U.S. cities in the analysis at 2.453%, while every city in the top 20 is located in New Jersey, Illinois, Connecticut, or New York state. On the other hand, four of the bottom five cities are found in Arizona—Scottsdale (0.296%), San Tan Valley (0.337%), Tempe (0.341%), and Flagstaff (0.347%)—while Mount Pleasant, SC boasts the lowest effective rate at 0.248%.
The analysis was conducted by Construction Coverage—a publication providing data and insight on housing costs, construction, and market dynamics—using data from the U.S. Census Bureau. For complete results, see Where Are U.S. Property Taxes Highest and Lowest? A State, County, and City Analysis on Construction Coverage.
States With the Highest Property Taxes
Counties With the Highest and Lowest Property Taxes
Cities With the Highest and Lowest Property Taxes
Methodology
Photo Credit: Robert Crum / Shutterstock
The data used in this analysis is from the U.S. Census Bureau’s 2024 American Community Survey. To determine the locations with the highest property taxes, researchers at Construction Coverage calculated the effective property tax rate for owner-occupied homes by dividing the aggregate annual real estate taxes paid by the aggregate value of housing units. In the event of a tie, the location with the greater median property taxes paid for owner-occupied homes was ranked higher.
For complete results, see Where Are U.S. Property Taxes Highest and Lowest? A State, County, and City Analysis on Construction Coverage.


