Photo Credit: Imagenet / Shutterstock
While the U.S. real estate market appears to finally be cooling down, home price growth has been a defining economic trend in recent years. Over the past decade, U.S. home values grew by more than 81%, compared to average hourly earnings which saw a modest 47% increase. Consequently, housing affordability has taken a hit, while homeowners have seen substantial gains in their real estate wealth.
To examine trends in home price growth, including which U.S. locations have seen the most growth and where this price growth has most outpaced household income, Construction Coverage—a company that provides construction industry resources, guides, and research—analyzed the latest data from Zillow, the U.S. Census Bureau, and the U.S. Department of Housing and Urban Development.
Here are the key takeaways from the analysis:
- Home prices have risen far faster than incomes and inflation over the past decade. Since 2016, U.S. home values have increased by more than 81%, substantially outpacing wage growth (+47%)—resulting in worsening housing affordability nationwide.
- Home price growth following the COVID-19 recession was initially rapid but has since normalized. National home prices surged 40% within just over two years after the 2020 recession before cooling to more typical long-term growth patterns by 2025, even as elevated mortgage rates continue to keep monthly housing costs high.
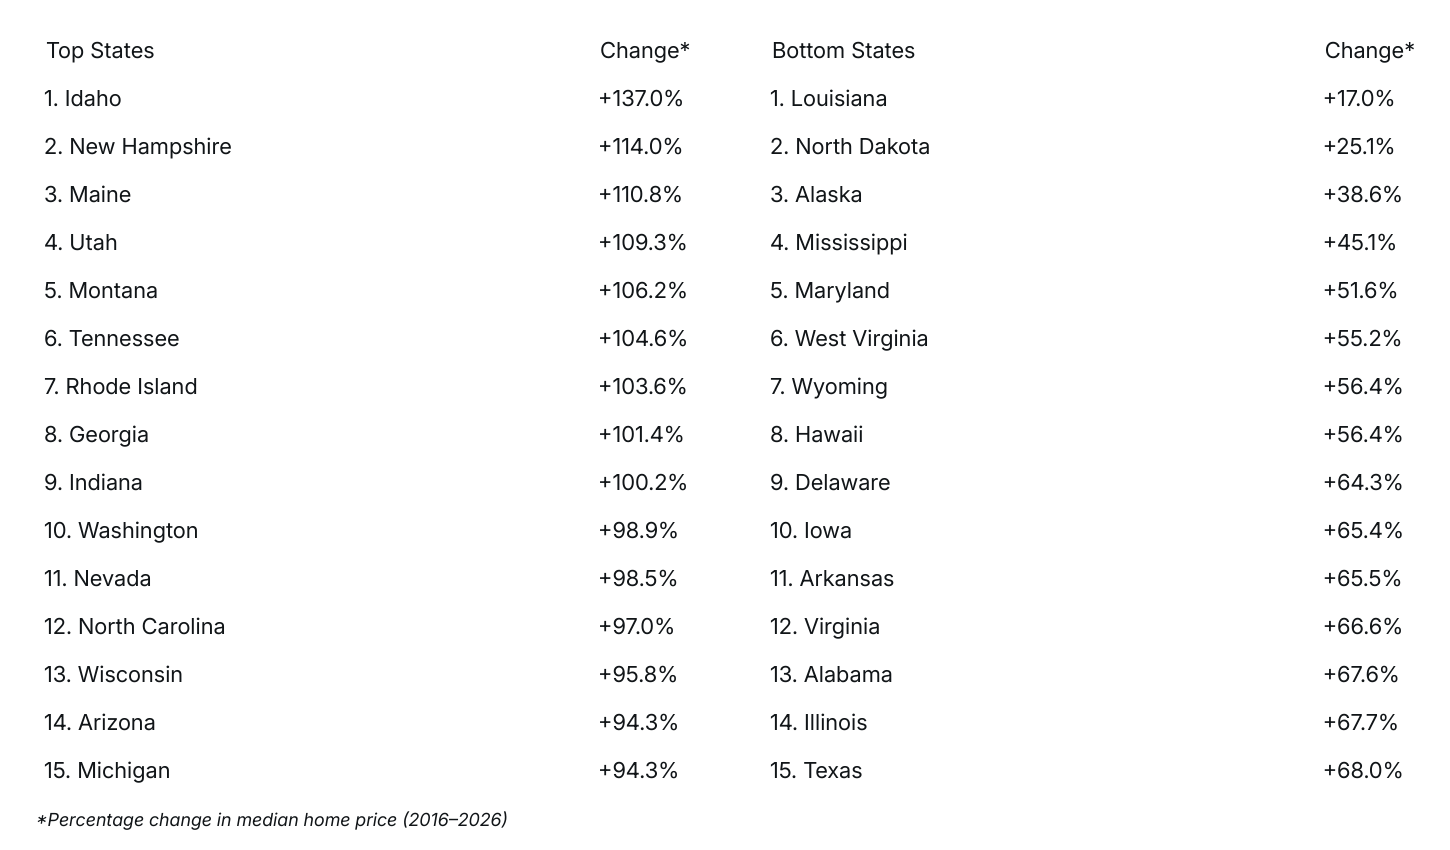
- Mountain West and New England states recorded the largest increases in home prices. Idaho (+137.0%) led all states in 10-year home price appreciation, followed by New Hampshire (+114.0%), Maine (+110.8%), and Utah (+109.3%), while Louisiana (+17.0%), North Dakota (+25.1%), and Alaska (+38.6%) saw the slowest growth.
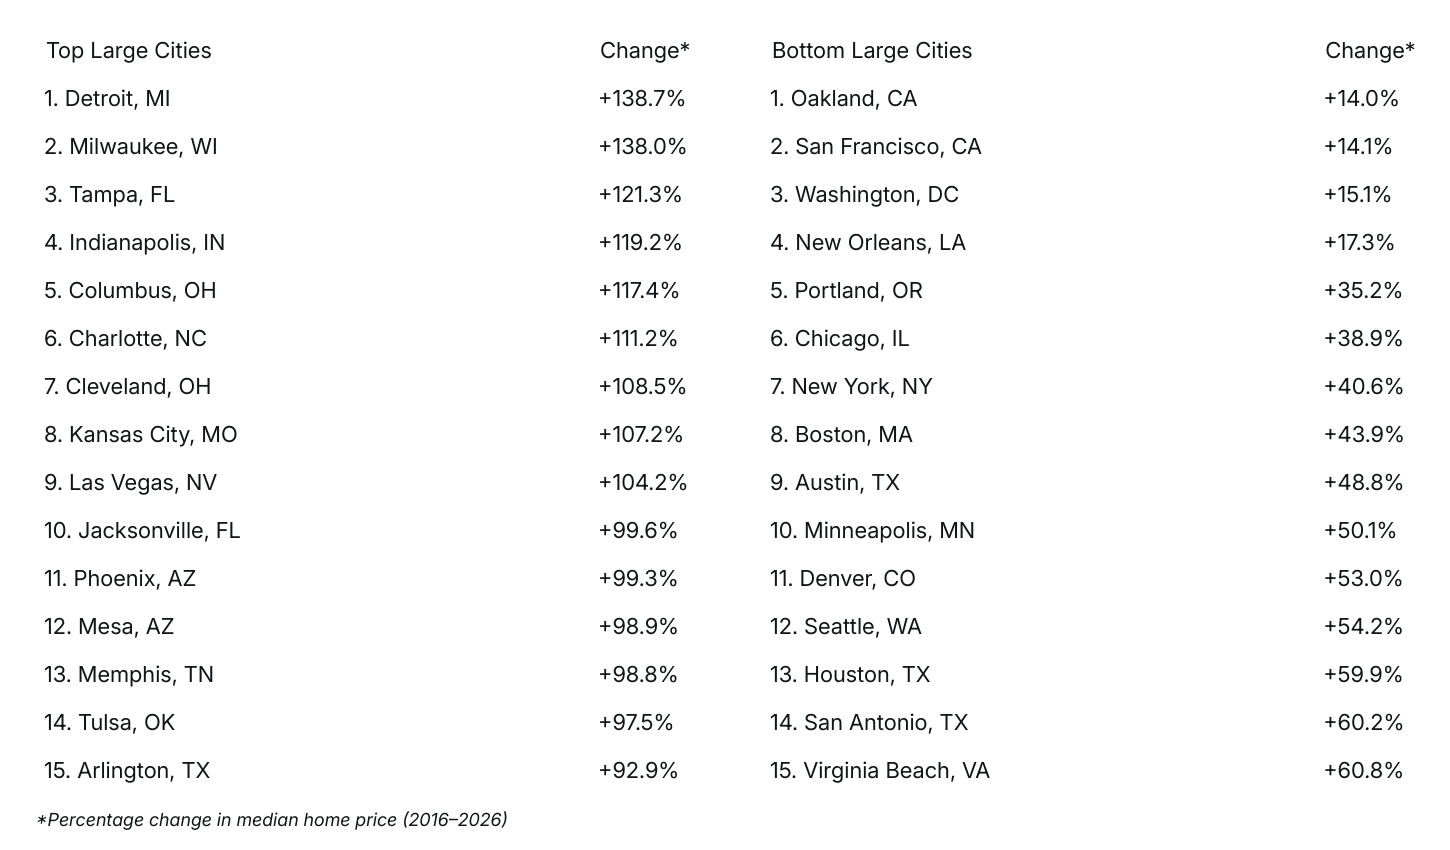
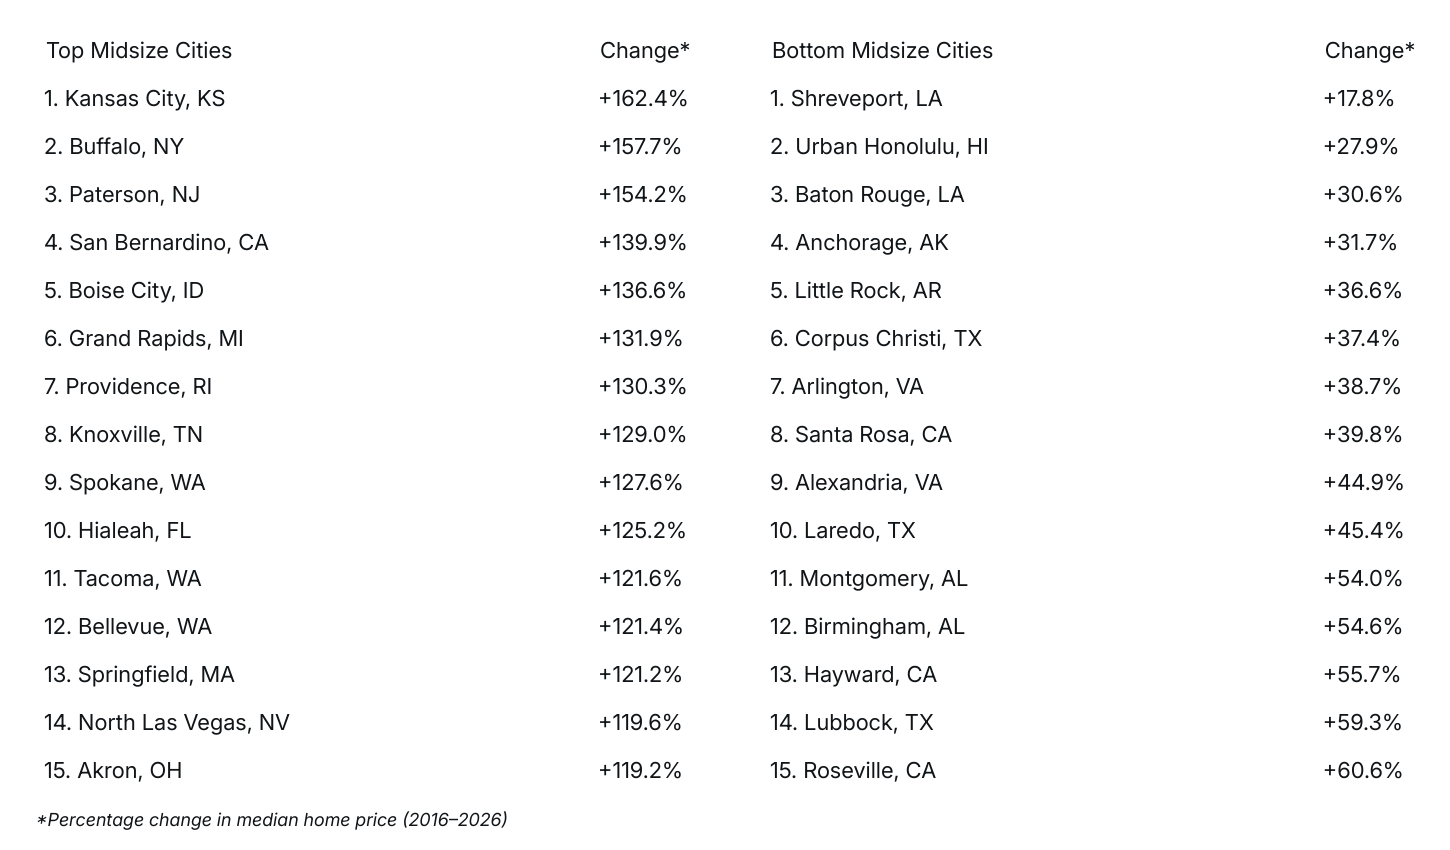
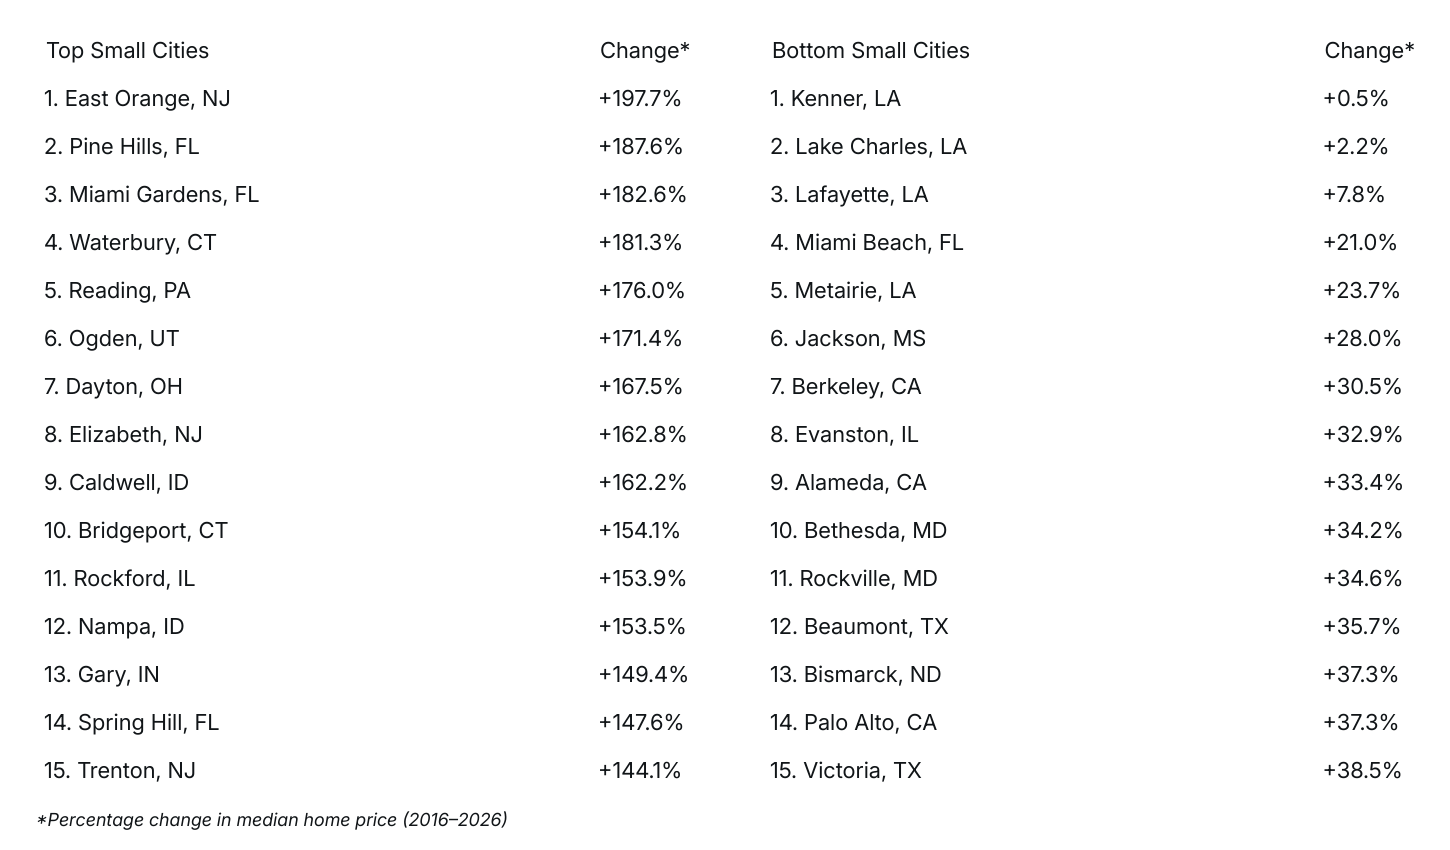
- Home price growth varied dramatically at the city level. Cities like East Orange, NJ (+197.7%), Pine Hills, FL (+187.6%), and Miami Gardens, FL (+182.6%) experienced some of the nation’s largest increases, while high-cost coastal markets such as Oakland, CA (+14.0%) and San Francisco, CA (+14.1%) posted comparatively modest gains over the past decade.
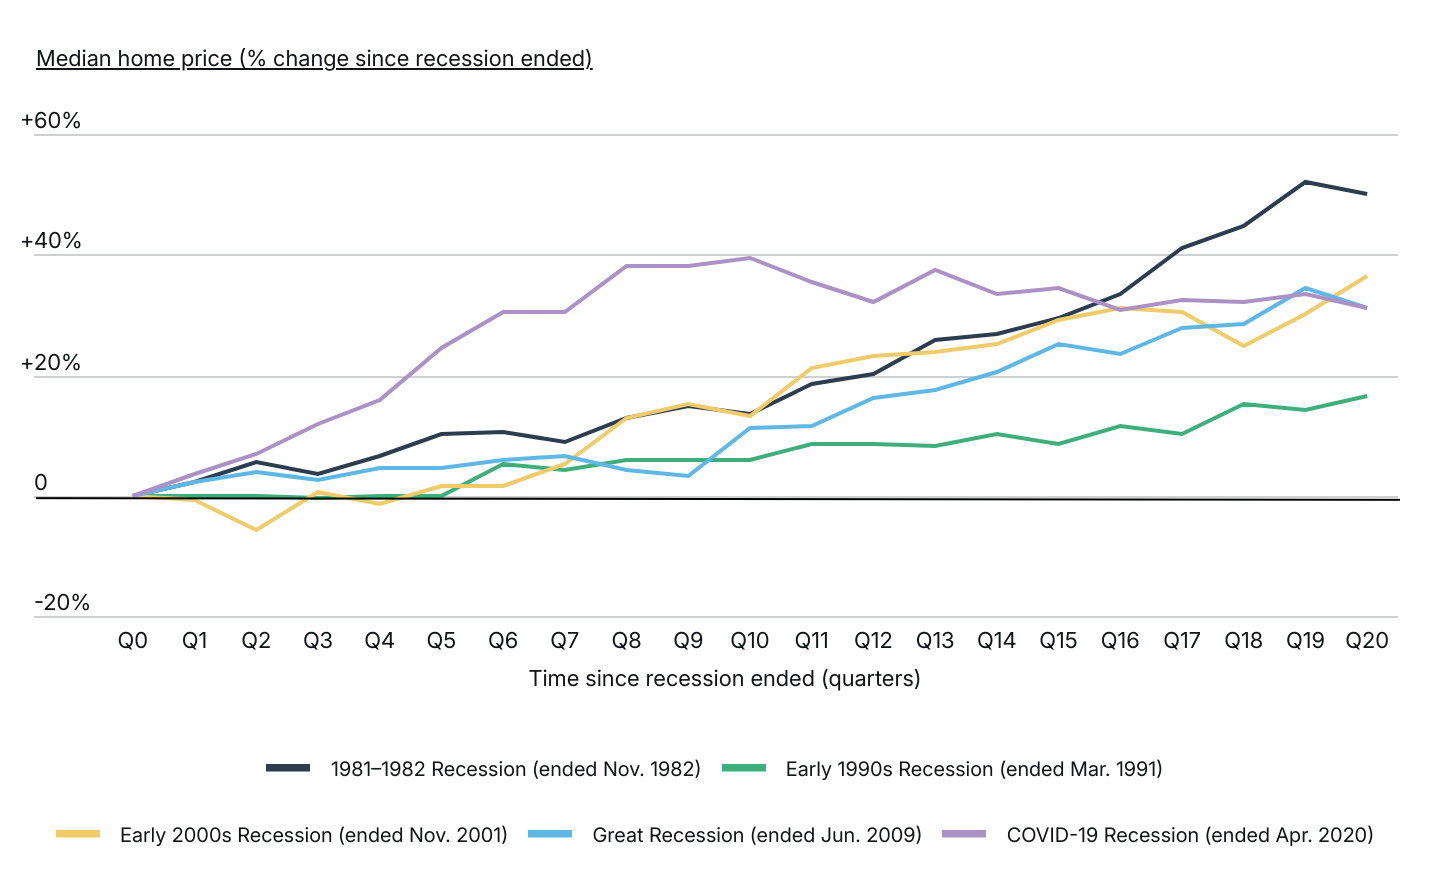
How Fast Have Home Prices Grown Since the COVID-19 Recession?
Home price growth after the COVID-19 recession was unprecedented but is now regressing to historical norms
Source: Construction Coverage analysis of U.S. Department of Housing and Urban Development data | Image Credit: Construction Coverage
Recent home price increases, though intensified by the unique circumstances of the COVID-19 pandemic, reflect a broader trend of above-average growth following economic recessions. Historically, U.S. housing markets have rebounded strongly after downturns, with median prices rising by an average of 33.6% over five years (20 quarters). Following the brief 2020 recession, home prices surged by an unprecedented 40% within just over two years but have since stabilized. By the second quarter of 2025—20 quarters after the recession officially ended—cumulative growth stands at 31.2%, closely mirroring historical patterns observed over similar recovery periods.
Despite recent declines in sale prices, homebuyers still haven’t experienced much in the way of financial relief. Persistent inflation continues to erode purchasing power and drive up home prices; concurrently, mortgage rates above 6% have kept monthly mortgage payments near record highs.
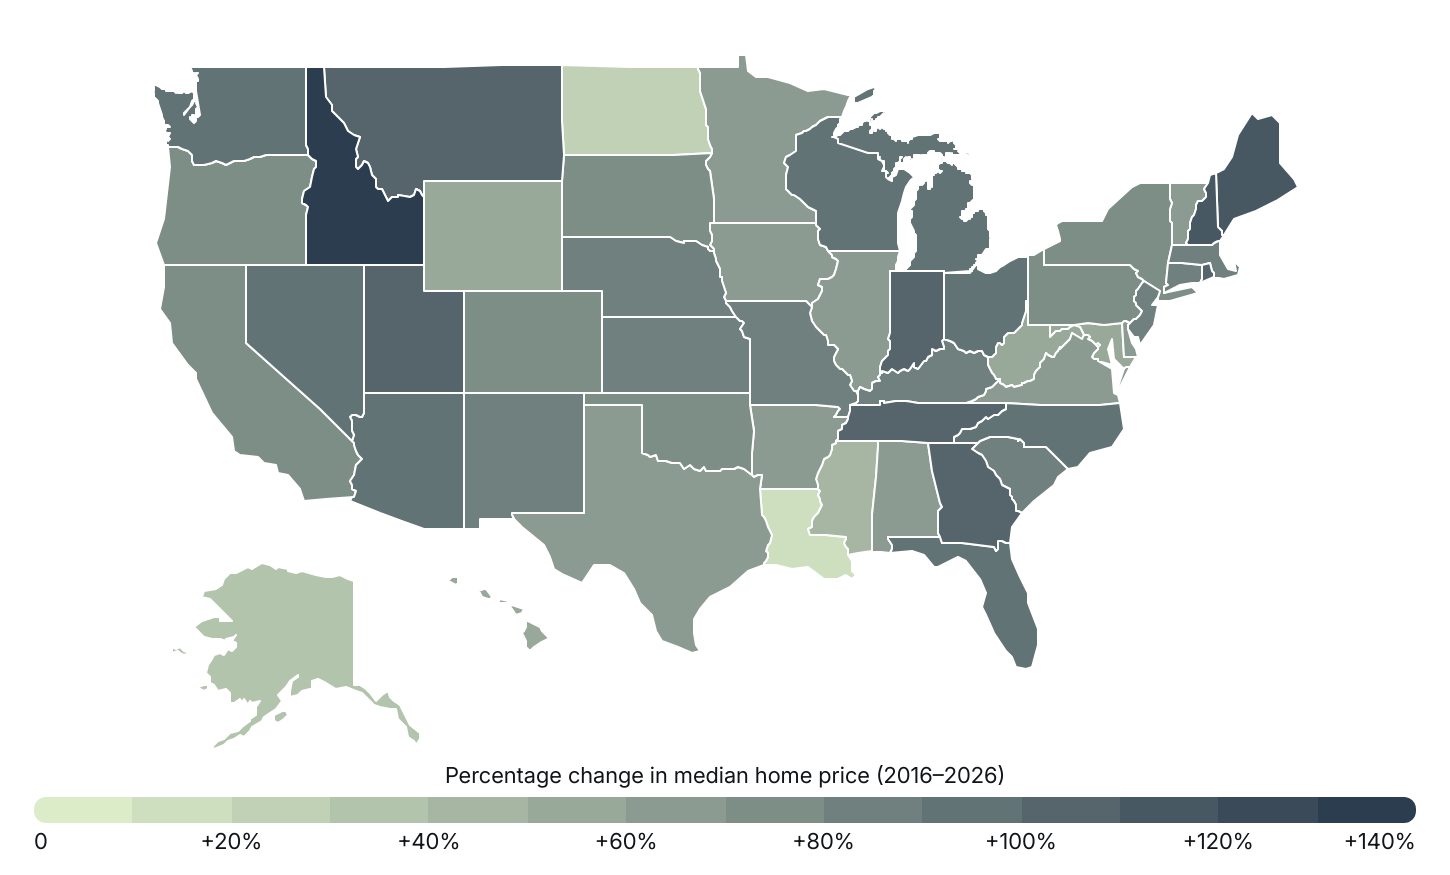
Home Price Growth by State Over the Past Decade
States in the Mountain West and New England saw the most significant home price growth over the past decade
Source: Construction Coverage analysis of Zillow data | Image Credit: Construction Coverage
The trajectory of economic recovery post-recession is uneven across the nation, and this trend has held true in the wake of both the Great Recession and the COVID-19 pandemic. The most substantial increases in home prices have been concentrated in Mountain West states and select states in New England. Since 2016, Idaho and New Hampshire have witnessed the most significant growth, with median home prices increasing by 137.0% and 114.0%, respectively. Other top states include Maine (+110.8%), Utah (+109.3%), Montana (+106.2%), Tennessee (+104.6%), Rhode Island (+103.6%), and Georgia (+101.4%).
Conversely, Louisiana (+17.0%), North Dakota (+25.1%), and Alaska (+38.6%) saw home price growth barely keeping pace with CPI growth over the past decade. Generally, parts of the Midwest, along with certain pockets of the South and Northeast, reported the slowest growth in home prices nationally during this period.
At the city level, locations in Florida notably stand out for their remarkable surge in home prices. For instance, in Pine Hills, FL, median home prices skyrocketed from approximately $95,000 in 2016 to nearly $273,000 as of March 2026, marking a 188% increase. In fact, 30 Florida cities reported price increases of over 100%—median home prices in those cities more than doubled in just 10 years.
The analysis was conducted by Construction Coverage, using data from Zillow and the U.S. Census Bureau. For more information, see the methodology section. For complete results, see Cities With the Largest Increase in Home Prices Over the Last Decade on Construction Coverage.
Cities With the Biggest 10-Year Increase in Home Price
States With the Biggest 10-Year Increase in Home Price
Methodology

Photo Credit: Imagenet / Shutterstock
The data used in the study comes from Zillow’s Zillow Home Value Index (ZHVI) and the U.S. Census Bureau’s American Community Survey. To find the cities with the largest increase in home prices over the last decade, researchers at Construction Coverage compared each location’s median home value in March 2016 and March 2026. Locations were then ordered by their respective percentage change in median home price over those 10 years, and, in the event of a tie, the location with the larger total change in home price over the last decade was ranked higher. Additionally, researchers calculated the percentage change in median household income from 2014 to 2024, the latest data available from the U.S. Census Bureau.
For relevance, only cities with complete data were included, and cities were broken into three cohorts based on population:
- Large: Cities with more than 350,000 people
- Midsize: Cities with 150,000–350,000 people
- Small: Cities with less than 150,000 people
For complete results, see Cities With the Largest Increase in Home Prices Over the Last Decade on Construction Coverage.