
Photo Credit: Stuart Monk / Shutterstock
After more than two years of stiff competition and fast-rising prices, the U.S. residential housing market experienced a rapid cooldown throughout the latter half of 2022 and the early months of 2023. Subsequently, after a turbulent few years of price surges, rapid cooldowns, and fluctuating mortgage rates, the U.S. housing market is entering 2026 with a new set of dynamics.
Driven by persistently elevated mortgage rates and widespread inflation, residential real estate demand has stagnated in many parts of the country. Affordability remains a major hurdle, especially for first-time buyers contending with high borrowing costs and limited supply in the entry-level segment—challenges that have prompted some markets to focus on expanding access to more affordable housing options. As we move into the prime spring and summer selling seasons, real estate activity will be top of mind, with certain metro areas emerging as particularly hot markets due to strong job growth, demographic shifts, and continued demand for housing.
How Have Home Sale Prices Changed Over Time?
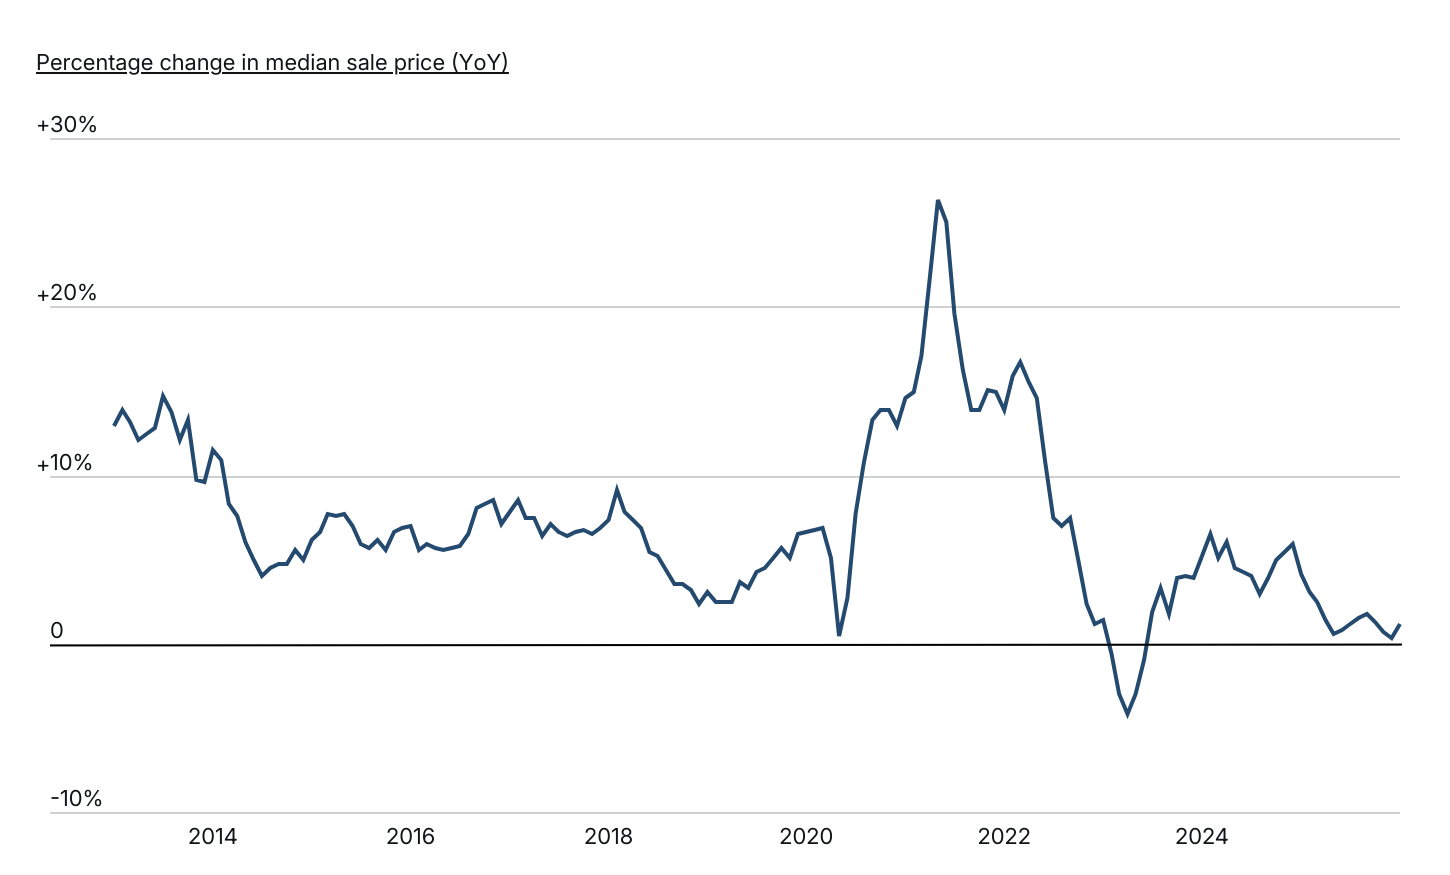
After a period of continued growth in 2024, home sale prices have cooled
Source: Construction Coverage analysis of Redfin data | Image Credit: Construction Coverage
As high mortgage rates continue to challenge affordability, home sale prices are plateauing. During the COVID-19 pandemic, home values soared, with year-over-year price growth peaking at 26.3% in May 2021 before gradually slowing. By late 2022, annual growth had fallen to just 1.0%, and by April 2023, prices had declined 4.1% from the previous year. After a period of growth in 2024 and recovering to historical norms, price growth has since cooled. As of January 2026, home prices were just 1.1% higher than the year prior.
Looking at the broader trend, home price growth has been cyclical over the past decade, with sharp surges during the pandemic followed by a market cooldown. While price growth is no longer as extreme, continued demand and limited inventory have kept upward pressure on home prices. Recent data suggests that even as affordability challenges persist, home prices continue to rise, albeit at a much more sustainable rate.
Residential Real Estate Sales Volume Trends
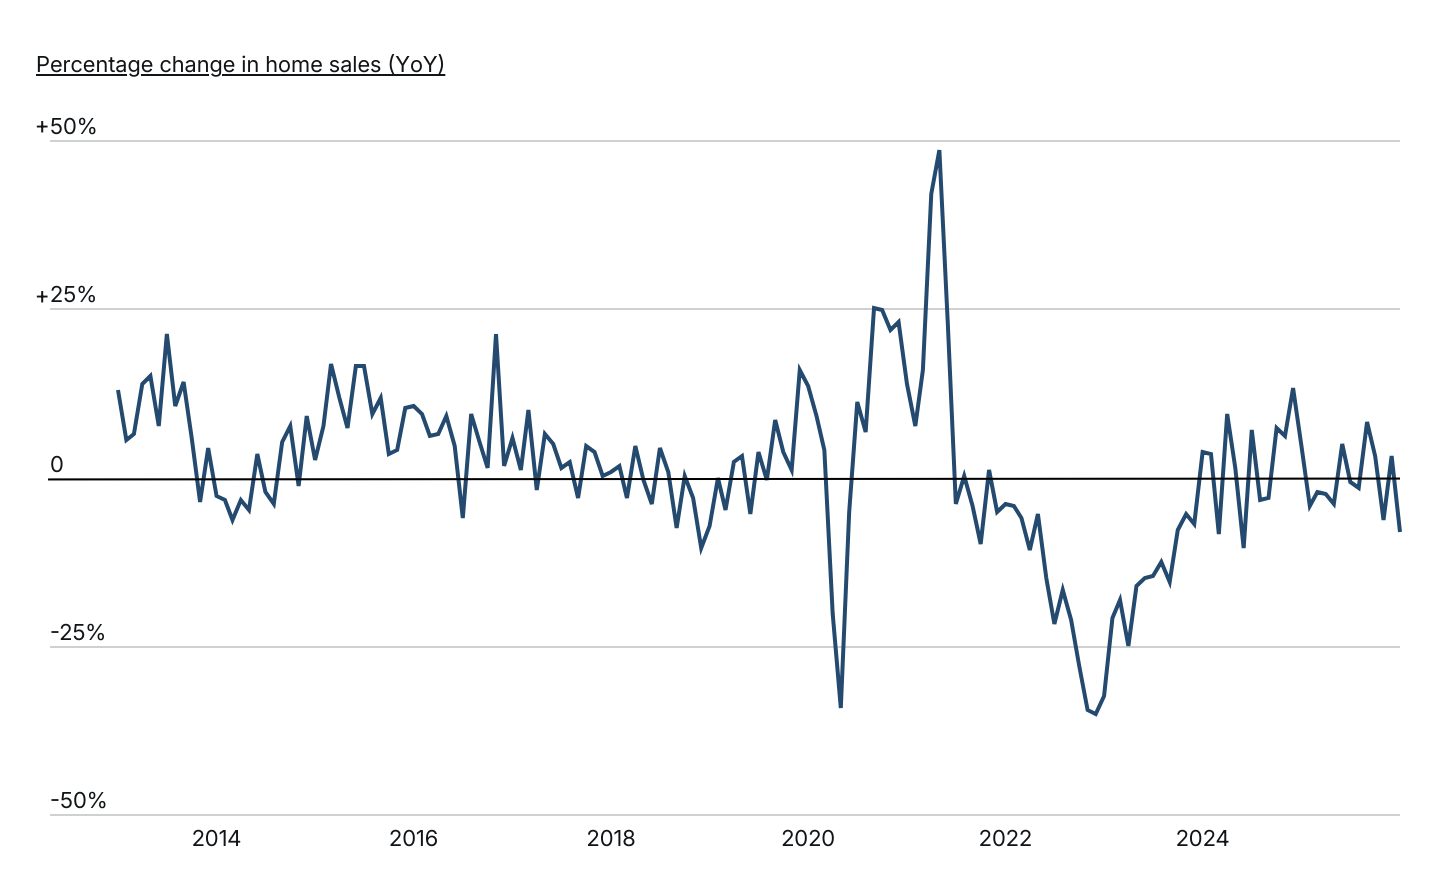
At the national level, the housing market is showing signs of a measurable slowdown
Source: Construction Coverage analysis of Redfin data | Image Credit: Construction Coverage
Similar to home prices, the trajectory of home sales has been a roller coaster in recent years. The COVID-19 pandemic initially brought transactions to a near standstill, with sales plummeting by more than a third from the spring of 2019 to the spring of 2020. When the market rebounded, sales surged, reaching a record 48.4% year-over-year increase in May 2021. However, as mortgage rates rose and affordability worsened, sales volume declined sharply, falling 35.1% year-over-year by December 2022.
Since early 2023, home sales have gradually recovered. Though still below pre-pandemic levels, sales were down just 7.1% year-over-year by the close of 2023, marking a significant improvement from the previous year’s steep declines. While that momentum continued into 2024, the market has since slowed. As of January 2026, home sales were down 8.3% compared to the year prior.
Geographical Differences in Real Estate Market Conditions
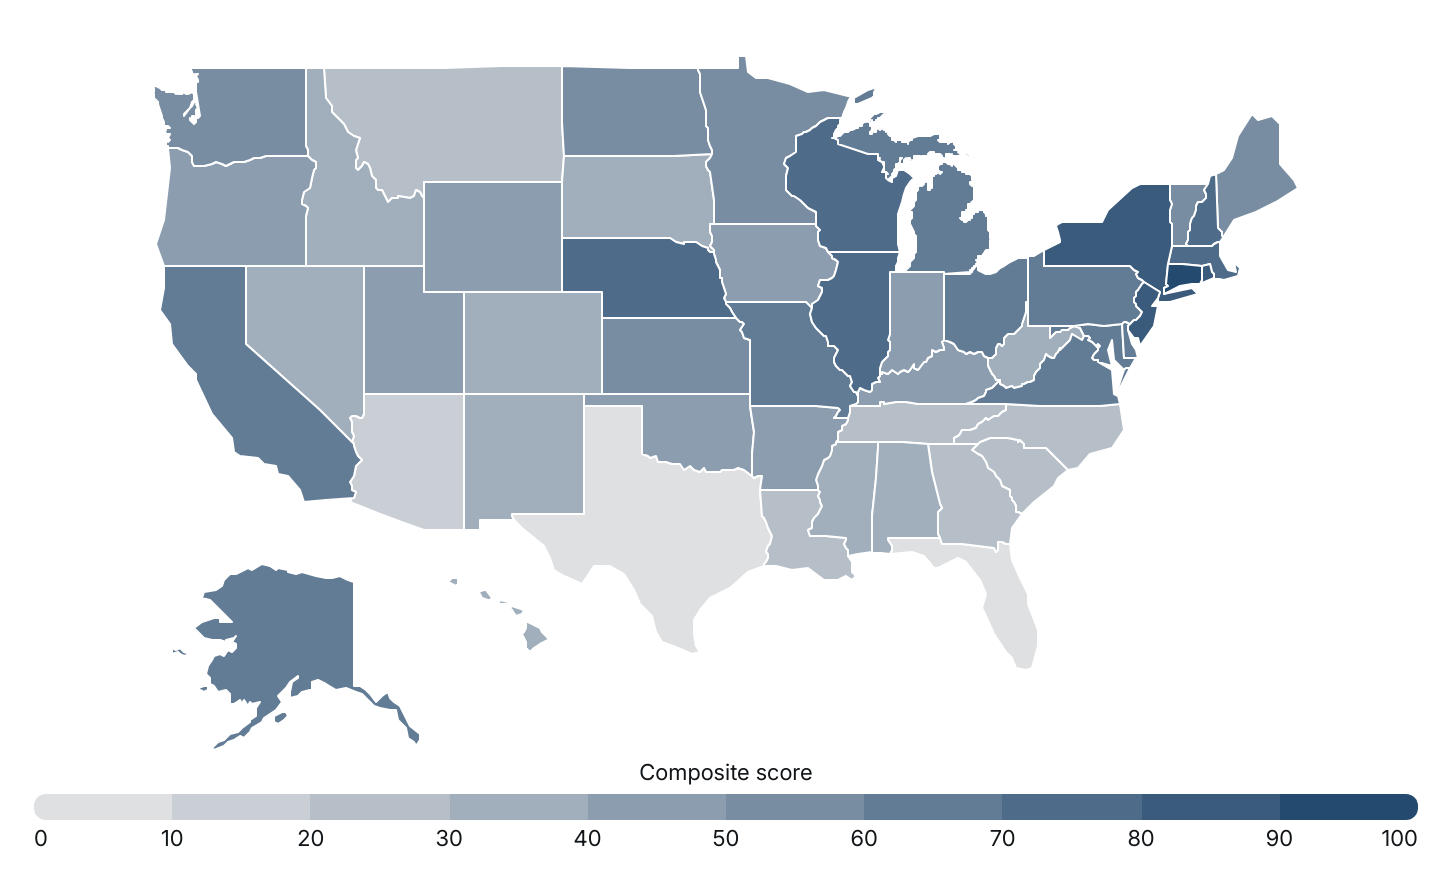
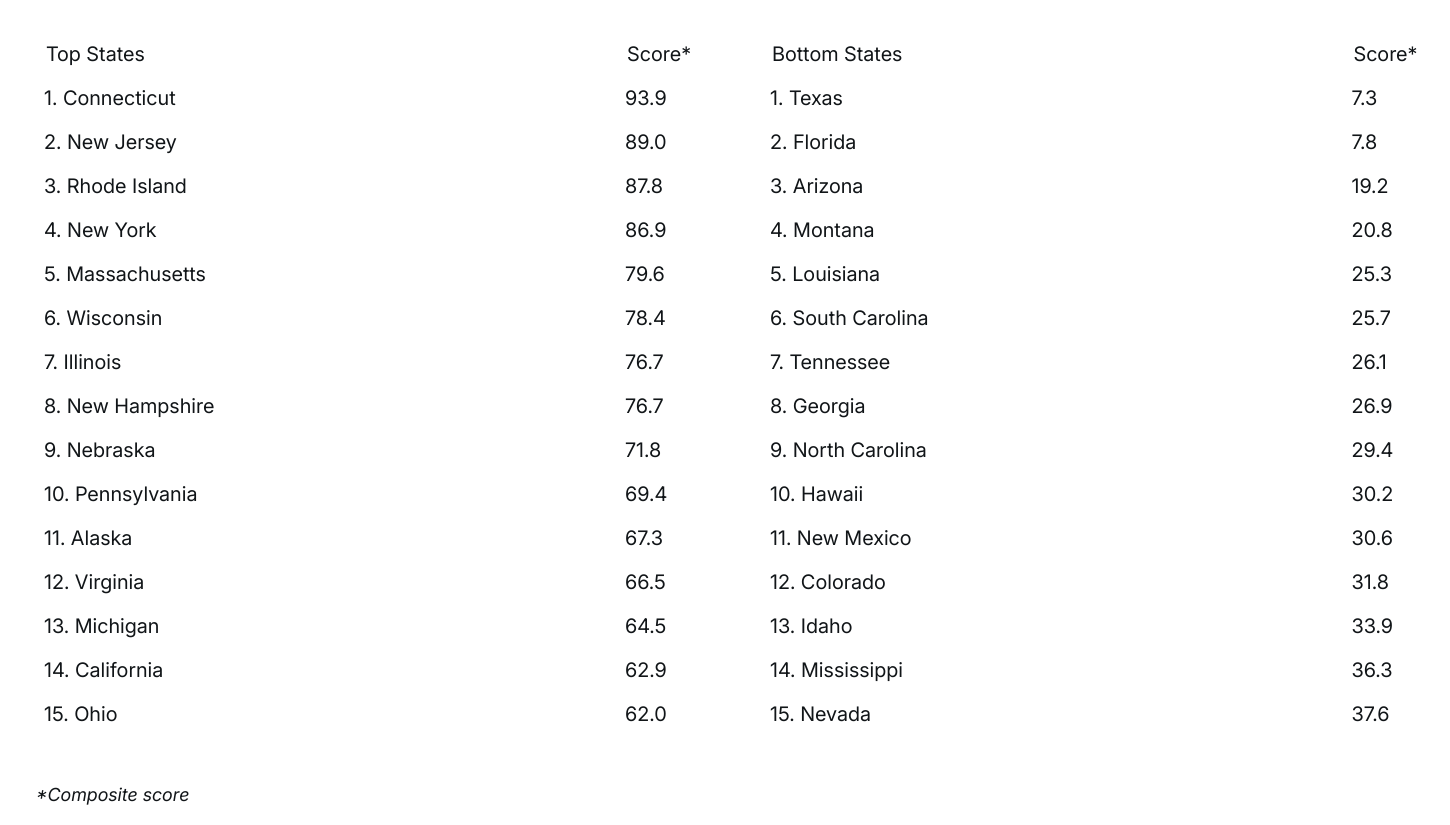
States in the Northeast have the hottest real estate markets
Source: Construction Coverage analysis of Redfin data | Image Credit: Construction Coverage
Although the national real estate market is showing signs of slowing down, some regions are seeing significantly more activity than others. To examine these differences, researchers at Construction Coverage—a publication that covers construction market trends—developed a composite score that ranks local real estate markets based on key indicators from Redfin, including:
- One-year change in median sale price (2024–2025)
- Share of homes that sold above asking (2025)
- Median number of days on the market (2025)
- Average sale-to-list percentage (2025)
- Share of listings with price drops (2025)
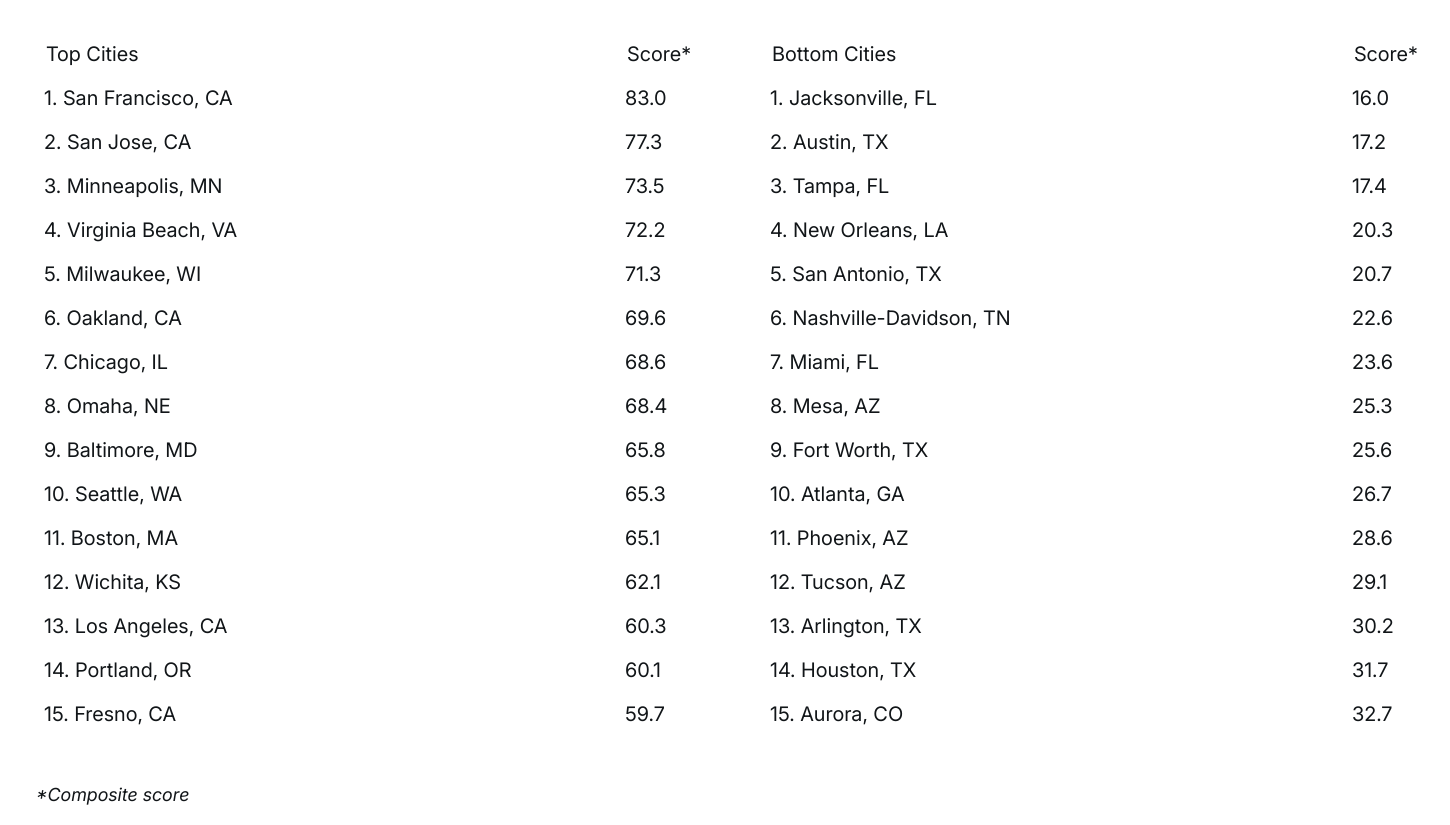
States in the Northeast dominate the rankings, with seven of the top 10 hottest states located in the Northeast. Connecticut leads the country with a composite score of 93.9, followed closely by New Jersey (89.0), Rhode Island (87.8), and New York (86.9). Despite its high cost of living, California ranks among the most active markets with a score of 62.9, and several of its northern metro areas—including San Francisco, San Jose, and Oakland—stand out as the hottest housing markets among large cities (those with populations over 350,000). One major factor driving demand in these areas is the difficulty of adding new housing supply. Densely populated cities in the Northeast and restrictive zoning laws in California have made it harder to build new homes, keeping supply tight and prices elevated.
Many Southern and Mountain West markets have cooled off. In 2021, Texas cities like Arlington, Fort Worth, and Austin ranked among the top 15 hottest markets. However, entering 2026, those same cities have dropped into the bottom 15 of the rankings. Similarly, Phoenix and Mesa, AZ, which were among the most in-demand real estate markets during the pandemic, now rank near the bottom. The rapid home price increases in these regions—combined with rising mortgage rates and return-to-office mandates—have made these once-popular migration destinations less attractive to buyers.
More information on how each statistic was computed is available in the methodology section. For complete results, see The Hottest Real Estate Markets in the U.S. on Construction Coverage.
Cities With the Hottest Real Estate Markets
States With the Hottest Real Estate Markets
Methodology

Photo Credit: Stuart Monk / Shutterstock
The data used in this analysis is from Redfin’s Data Center. To determine the locations with the hottest real estate markets in 2026, researchers at Construction Coverage created a composite score, equally weighting the following metrics:
- One-year change in median sale price (2024–2025)
- Share of homes that sold above asking (2025)
- Median number of days on the market (2025)
- Average sale-to-list percentage (2025)
- Share of listings with price drops (2025)
In the event of a tie, the location with the greater one-year change in median sale price was ranked higher. Researchers also reported the median home sale price from January 2026. Cities were grouped into cohorts based on population size: small (less than 150,000), midsize (150,000–349,999), and large (350,000 or more). Note, locations with insufficient data were excluded for quality purposes.
For complete results, see The Hottest Real Estate Markets of 2026 on Construction Coverage.